
Calgary’s Income Landscape: Statistics, Inequality, and Future

Key Insights
| According to Statistics Canada, out of 1,056,225 individuals aged 15 and older, a total of 1,003,515 in 2020 reported receiving some form of income. The same report also shows that the highest concentration of earners according to total income was in the income bracket of $100,000 and over, with 155,825 individuals in this category. Data from the Calgary Economic Development shows that the city’s median income after taxes rose slightly from $74,100 in 2018 to $75,300 in 2019. The Alberta Regional Dashboard reveals that Calgary’s median family income of $108,560 in 2021 was down 8% from the total in 2020. Statistics Canada highlights Calgary’s income gap, as men earned an average income of $79,400 while women earned only $54,300 in 2022. |
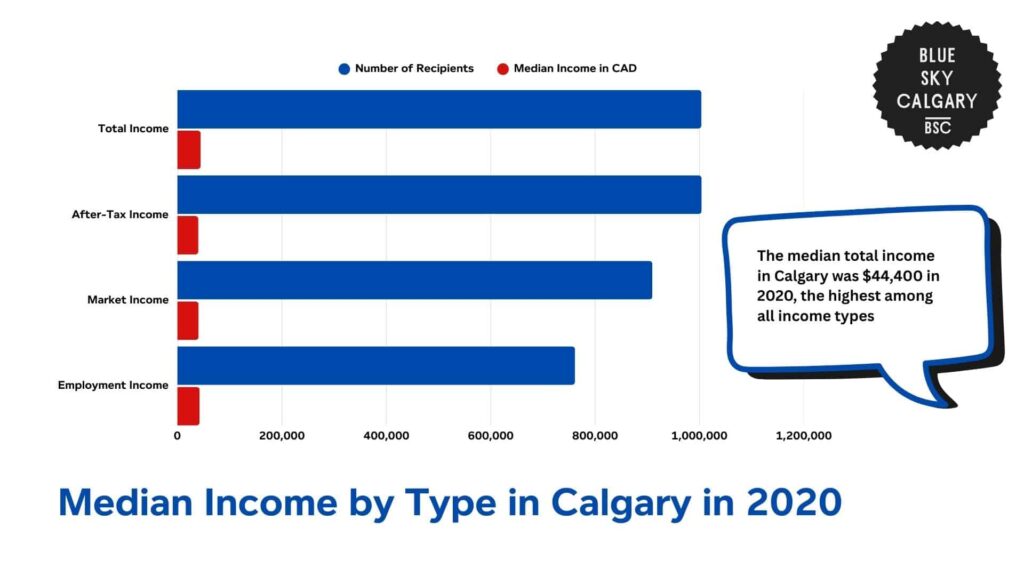
Statistics Canada reveals income trends and patterns for Calgary’s residents in 2020.
In 2020, 1,056,225 individuals aged 15 and older resided in private households. Out of all of them, 1,003,515 individuals reported receiving some type of income, which is 95% of the working-age and adult population.
The average total income for this population of recipients was $44,400. This represents every source of income before deductions, ranging from wages earned in employment to income from investments and government transfers.
After tax deductions, the median income dropped to $40,000 for 1,004,015 recipients. This difference reflects how taxation affects individual resources and shows how disposable income is much lower than gross pay.
Meanwhile, 909,585 people reported receiving a market income, which comes from employment and self-employment income, as well as private pensions and investments.
The median market income for this group was $40,400. This figure is very close to the after-tax income amount, which shows that most of Calgary’s population mainly earned income from market sources.
Similarly, employment income was recorded by 761,365 persons, which is a smaller number. Their median was $42,400, which is also close to Calgary’s after-tax median income amount.
| Income Type | Number of Recipients | Median Income in CAD |
| Total Income | 1,003,515 | 44,400 |
| After-Tax Income | 1,004,015 | 40,000 |
| Market Income | 909,585 | 40,400 |
| Employment Income | 761,365 | 42,400 |
Breakdown of Income Classes in Calgary
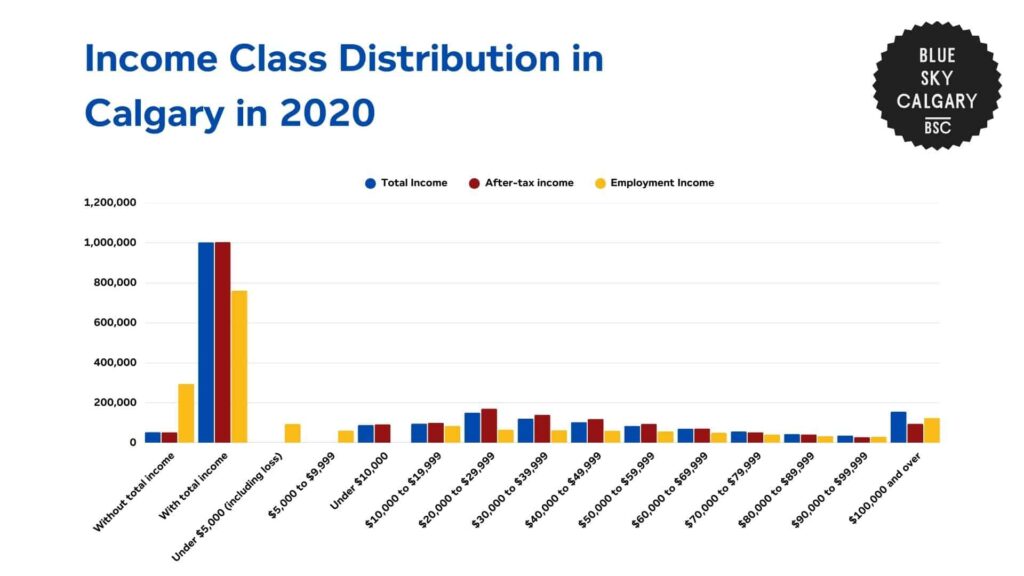
The same report by Statistics Canada further shows the spread of earnings in Calgary across income classes.
Of the 1,056,220 persons aged 15 and older residing in private households, 1,003,510 reported receiving an income, while 52,710 reported none.
The greatest number of earners in this group was in the highest income bracket of $100,000 and over, with 155,825 individuals.
This was closely followed by the group in the $20,000 to $29,999 income bracket, with 150,395 individuals.
The smallest group under this category, at 36,520 individuals, were those in the $90,000 to $99,999 category. This is also the second highest-earning group in Calgary.
Meanwhile, after-tax income statistics show a slightly different trend. The biggest group was in the $20,000 to $29,999 range, with 170,545 people.
The second largest was the $30,000 to $39,999 range, with 139,800 people. These figures indicate that most residents earned moderate after-tax income.
Moreover, the $90,000 to $99,999 group had the smallest number, with just 28,220 people. This shows that much fewer individuals fall in the upper-middle income level after taxes are deducted.
Finally, the distribution of employment income revealed the largest gap. The largest group of earners, at 124,415 persons, belonged to the $100,000 and above group.
Meanwhile, the second largest group comprised those who earned less than $5,000, at a total of 93,565 persons.
These numbers suggest that a significant proportion of the population either had little or more volatile employment income. This is most likely from part-time employment, unemployment, or temporary exits from the labor force.
Similar to the other income categories, the lowest employment income category was between $90,000 and $99,999, with just 29,855 persons.
All this data reveals a wide gap in Calgary’s income trends. Most people either had very low or very high incomes, with fewer individuals falling in the mid-to-upper income ranges.
| Income Bracket | Total Income | After-tax income | Employment Income |
| Without total income | 52,710 | 52,205 | 294,855 |
| With total income | 1,003,510 | 1,004,020 | 761,365 |
| Under $5,000 (including loss) | – | – | 93,565 |
| $5,000 to $9,999 | – | – | 61,265 |
| Under $10,000 | 88,650 | 92,205 | – |
| $10,000 to $19,999 | 95,485 | 99,660 | 84,600 |
| $20,000 to $29,999 | 150,395 | 170,545 | 65,430 |
| $30,000 to $39,999 | 120,085 | 139,800 | 62,020 |
| $40,000 to $49,999 | 102,800 | 119,345 | 60,110 |
| $50,000 to $59,999 | 84,010 | 94,265 | 56,160 |
| $60,000 to $69,999 | 69,945 | 71,155 | 50,010 |
| $70,000 to $79,999 | 56,175 | 52,530 | 40,770 |
| $80,000 to $89,999 | 43,630 | 41,555 | 33,160 |
| $90,000 to $99,999 | 36,520 | 28,220 | 29,855 |
| $100,000 and over | 155,825 | 94,730 | 124,415 |
Regional Analysis of Median After-Tax Income Across Canada
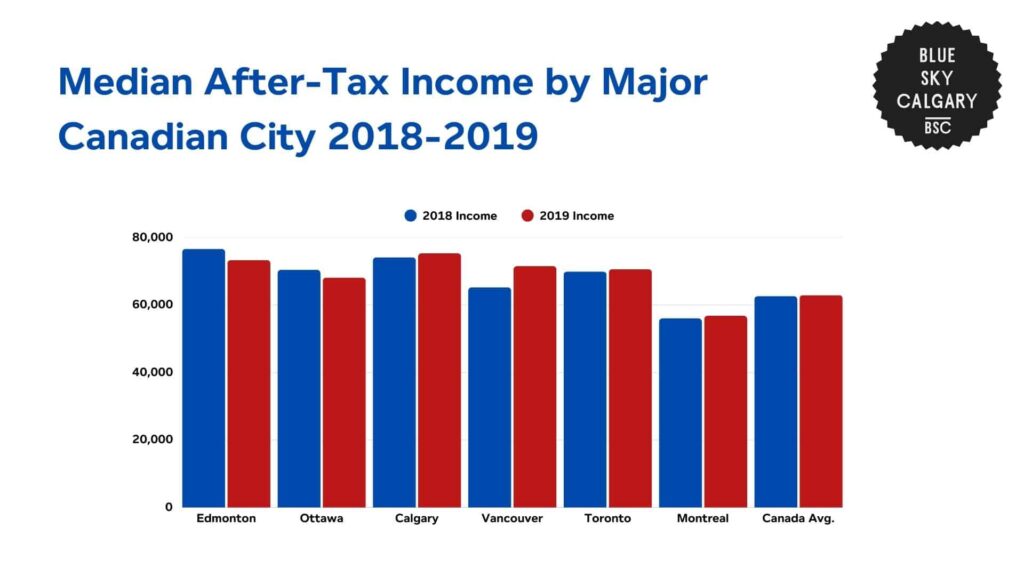
The Calgary Economic Development’s Fact Sheet shows how Calgary was the highest-earning city in 2019 when looking at after-tax income for families and individuals without attachments.
Calgary’s median after-tax income was $75,300 in 2019, which was up slightly from $74,100 in 2018.
Nationally, the Canadian average was $62,900 in 2019, which also shows that the average for Calgary is 17% higher than the national median.
Edmonton followed closely in second place, with a median income of $73,300. Despite holding the top position in 2018, Edmonton saw a decline from $76,600 during the previous year, which caused it to drop below Calgary.
Meanwhile, Vancouver ranked third in 2019 with a median income of $71,500. This was a considerable improvement from $65,200 in 2018 and was one of the biggest year-over-year increases.
Toronto ranked fourth at $70,600, with a slight improvement over its 2018 total of $69,900. Meanwhile, Ottawa ranked fifth at $68,100, which is also a decrease from $70,400 in the previous year.
Montreal was at the bottom of the list with a median after-tax income of $56,800 in 2019. This figure did not change much from last year’s figure of $56,600, representing more stagnant family earnings.
| City | 2018 Income | 2019 Income |
| Edmonton | 76,600 | 73,300 |
| Ottawa | 70,400 | 68,100 |
| Calgary | 74,100 | 75,300 |
| Vancouver | 65,200 | 71,500 |
| Toronto | 69,900 | 70,600 |
| Montreal | 56,000 | 56,800 |
| Canada Avg. | 62,600 | 62,900 |
Median Family Income in Calgary
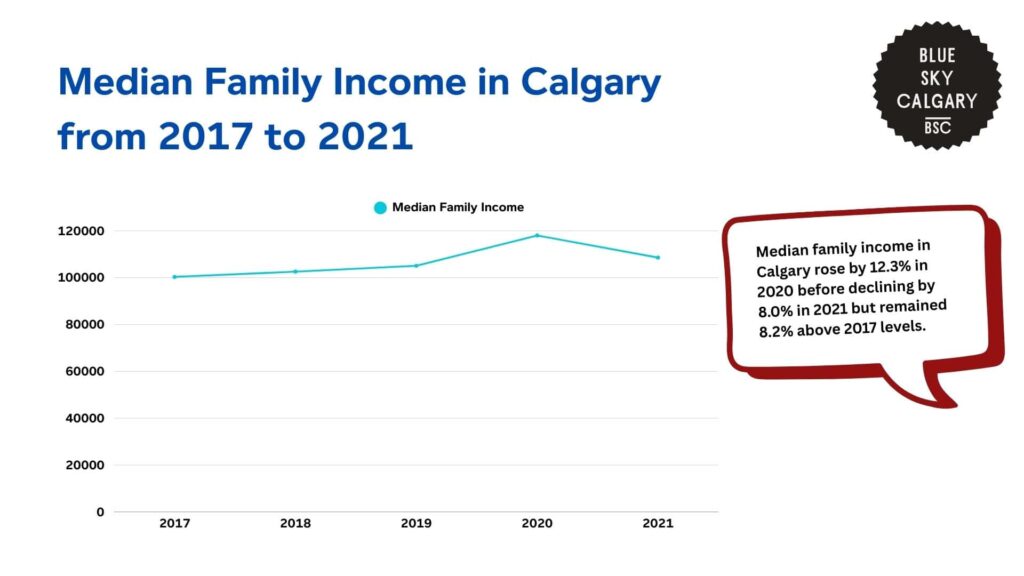
The Alberta Regional Dashboard reveals how Calgary’s median family income has changed over a period of five years.
Between 2017 and 2021, the median family income in Calgary experienced a mix of both drops and increases.
In 2017, the median family income was $100,320. This number went up by 2.2% from 2018 to $102,570.
Meanwhile, in 2019, this upward movement continued as income rose again by another 2.4% to $105,060. These two consecutive rises show gradual improvements in household earnings during this period.
In 2020, the family median income jumped to $118,000, which is a 12.3% increase from the prior year. This was the biggest one-year increase over the five years.
This sharp spike coincided with the start of the COVID-19 pandemic when many families saw their incomes supplemented by significant federal support payments.
These transfers may have temporarily increased disposable income, particularly for families who had experienced job loss or fewer hours due to the pandemic.
However, the median family income dropped to $108,560 in 2021, which was down 8.0% from 2020. Despite this decline, incomes were still well above pre-pandemic levels.
Compared to 2017, the 2021 number was still 8.2% higher, suggesting that overall income growth was maintained despite the economic uncertainty of the pandemic.
This five-year pattern highlights how Calgary has enjoyed relatively stable income patterns and increases over this period.
| Year | Median Family Income |
| 2017 | 100,320 |
| 2018 | 102,570 |
| 2019 | 105,060 |
| 2020 | 118,000 |
| 2021 | 108,560 |
Demographic Breakdown of Income Trends in Calgary
Various reports from Statistics Canada show how income trends vary across different demographics in Calgary.
Income Trends by Gender
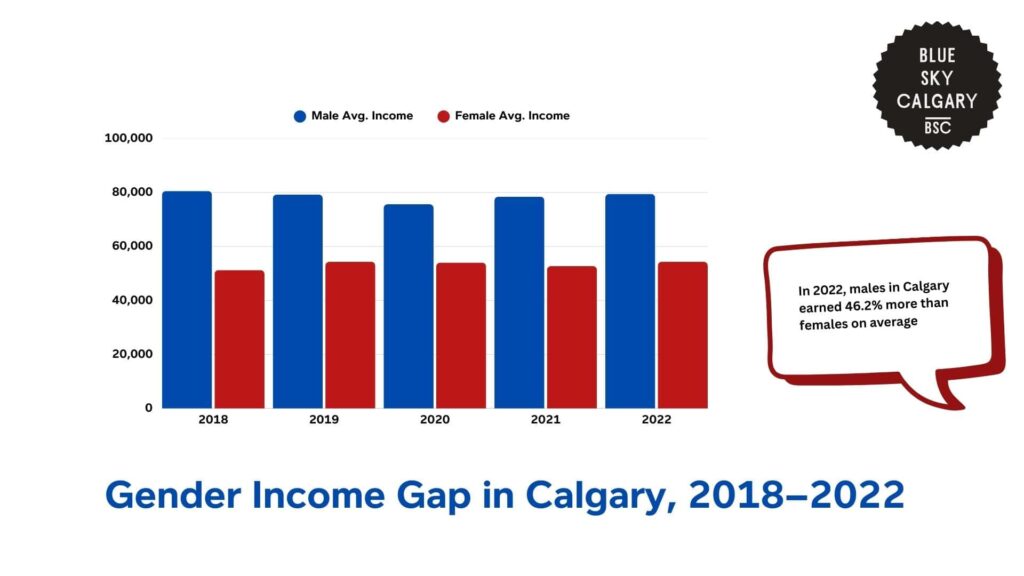
Men and women in Calgary have had similar income disparities over the five years between 2018 and 2022.
Males have always earned more than females in average and median income brackets each year, which shows that there is a gender income gap in the city.
In 2022, men earned an average salary of $79,400, while women earned $54,300. This shows that men earned an average of 46.2% more than women for that year.
The disparity in median earnings was also wide. Men earned a median income of $56,700, while women averaged $40,300, which is a 40.7% difference.
These gaps have been fairly consistent over time. In 2018, the average income for men was $80,500, while for women, it was $51,200. This was a difference of $29,300, or 57.2%.
Meanwhile, median income was $53,000 for men and $40,800 for women, which is another gap of 29.9%.
While the size of the gap varied from year to year, this general income gap persisted.
Both genders faced a decline in average income in 2020, which is most likely due to the effects of the pandemic on labor force participation.
Notably, women recovered somewhat faster in average income by 2022, as they returned to $54,300. This was also their 2020 income level.
However, the median earnings for women in 2022 were still below what they had been in 2019 and 2020. This shows that although some of the loss was regained, many women were still in lower-earning categories.
These patterns indicate that gender-based income inequality in Calgary is structural and has not decreased over the years.
Both mean and median income values consistently indicate that men are paid more than women, with only some variations.
| Year | Male Avg. Income | Female Avg. Income | Male Median Income | Female Median Income |
| 2018 | 80,500 | $51,200 | 53,000 | $40,800 |
| 2019 | 79,200 | $54,300 | 58,900 | $41,100 |
| 2020 | 75,600 | $54,000 | 53,800 | $41,200 |
| 2021 | 78,400 | $52,700 | 49,100 | $38,900 |
| 2022 | 79,400 | $54,300 | 56,700 | $40,300 |
Income Trends by Age
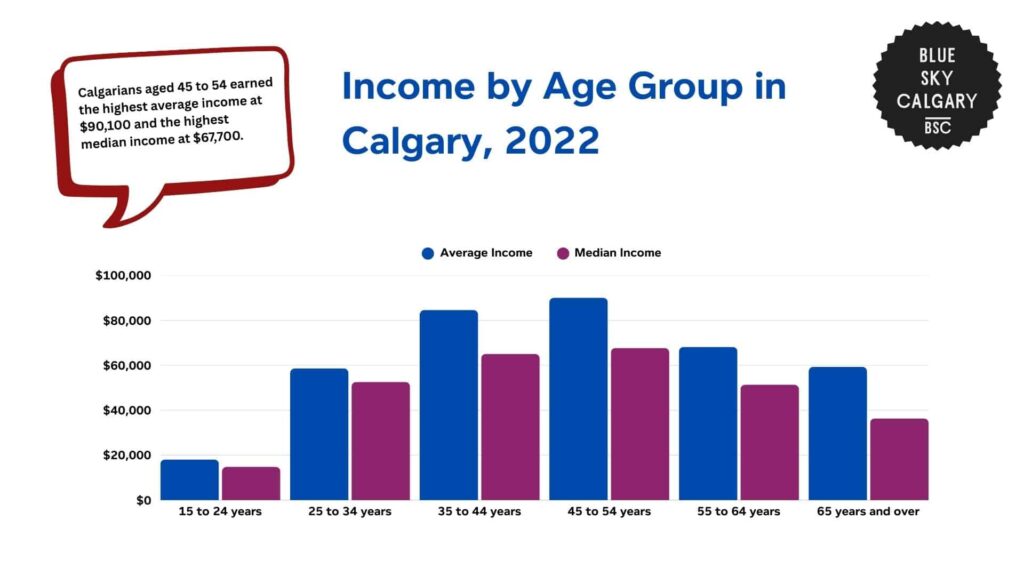
Income levels in Calgary in 2022 were affected by age, with higher wages for young to mid-career age groups and steady decreases for older groups.
For example, the lowest incomes were seen among those between the ages of 15 and 24. This age bracket earned an average income of $18,100 and a median income of $14,800.
These numbers illustrate how many in this group are in their early career stage, either working part-time, studying, or just entering the workforce.
The notable difference between median and average incomes also suggests that a few higher earners might be pushing the average upward.
Meanwhile, income increased dramatically in the 25 to 34 age bracket, where the average income was $58,600 and the median was $52,600.
Those in this group are early-to-mid-career professionals with secure employment, more experience, and higher earning potential. Their average and median incomes are roughly three times greater than that of the previous age group.
This upward trend continued among those 35 to 44 years of age. They had a mean income of $84,600 and a median income of $65,100.
These increases coincide with promotions and raises as these people advance in their careers. The disparity between the median and average for this group is also higher, which shows more variation in career growth.
Income was highest for the 45 to 54 age group. Their average was $90,100, which was the greatest of all ages, and their median income was $67,700.
Those in this category are generally well-established in their careers, possess acquired skills, are in executive positions, and have access to better-paying employment.
This also had one of the widest gaps between median and average income, most likely due to the effects of high-earning people bringing up the group average.
However, incomes start to decrease after this age range, with the 55 to 64 group earning a smaller average of $68,200 and a median of $51,400.
This decline reflects the move toward shorter working hours, early retirement, or a change in work patterns.
Among those 65 years and older, income levels decreased further. The mean income was $59,300, and the median was $36,400.
This mirrors the shifting of individuals away from work income towards pensions, retirement savings, or government income.
The difference between the average and median remained large, which may indicate that a few elderly individuals were still earning more than the average, perhaps from investments or ongoing work.
| Age Group | Average Income | Median Income |
| 15 to 24 years | $18,100 | $14,800 |
| 25 to 34 years | $58,600 | $52,600 |
| 35 to 44 years | $84,600 | $65,100 |
| 45 to 54 years | $90,100 | $67,700 |
| 55 to 64 years | $68,200 | $51,400 |
| 65 years and over | $59,300 | $36,400 |
Costs and Consequences of Income Inequality in Canada
A study by Policy Options Politiques reveals how income disparity in Canada remains on the rise, with profound implications for household welfare and overall economic stability.
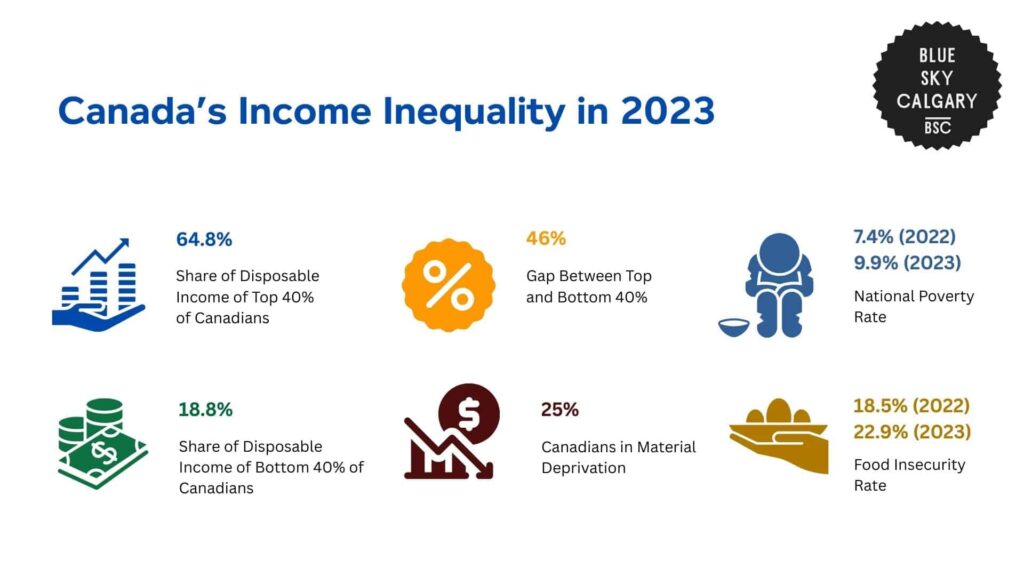
The top 40% of earners in Canada possessed 64.8% of the country’s disposable income as of the fourth quarter of 2023.
Conversely, the bottom 40% held only 18.8% of this total income. This is a large 46-percentage-point difference, which reveals a concerning income gap in the country.
Meanwhile, the wealthiest 20% of families also experienced a significant spike in their disposable incomes, as they earned an additional $11,266 between 2022 and 2023.
This boost was caused by increased wages and stronger returns on investment and shows that the wealthiest Canadians continued to enjoy even more income while the wealth divide in the country grew.
On the other end of the spectrum, the lowest 20% of the population experienced a disposable income rise of only $93 or 0.3%.
These families also saw decreases in investment income and transfer payments since they tended to have fewer assets and more debt. Likewise, they are also less likely to be able to take advantage of higher interest rates.
Furthermore, the 2022 Canada Income Survey reported that the country’s poverty rate increased to 9.9% from 7.4% in 2021.
Food insecurity also jumped, reaching 22.9% of households in 2023 from 18.5% in 2022. These are signs of increasing economic hardships among low-income Canadians.
A 2023 Food Bank Canada report identified that one-quarter of Canadians experience poverty as quantified by a material deprivation measure.
This equates to 25% of Canadians being unable to afford two or more vital goods or services, including food, clothing, dental services, or home heating.
The increasing cost of living, mainly for basic items such as food, housing, energy, and transport, puts more pressure on low-income families.
Thus, a large number of them are forced to use a majority of their disposable income on necessities without having any allowance for savings or contingencies.
In addition to individual pressures, income inequality also generates more extensive social and economic hazards. It is associated with worse health, lower trust, and lower labor market participation.
The report shows that high-inequality nations experience lower GDP per capita and economic mobility over the long term. In Canada, these patterns can harm social cohesion and economic opportunity.
Moreover, public concern about this wealth divide is also widespread. A 2021 OECD study found that 60% of Canadians believe income inequality in the country is too high, showing that perceptions of unfairness are now a mainstream issue for the public.
| Relevant Information | Statistics |
| Share of Disposable Income of Top 40% of Canadians | 64.8% |
| Share of Disposable Income of Bottom 40% of Canadians | 18.8% |
| Gap Between Top and Bottom 40% | 46 percentage points |
| National Poverty Rate | 7.4% (2022)9.9% (2023) |
| Food Insecurity Rate | 18.5% (2022)22.9% (2023) |
| Canadians in Material Deprivation | 25% |
Interventions and Solutions to Income Inequality
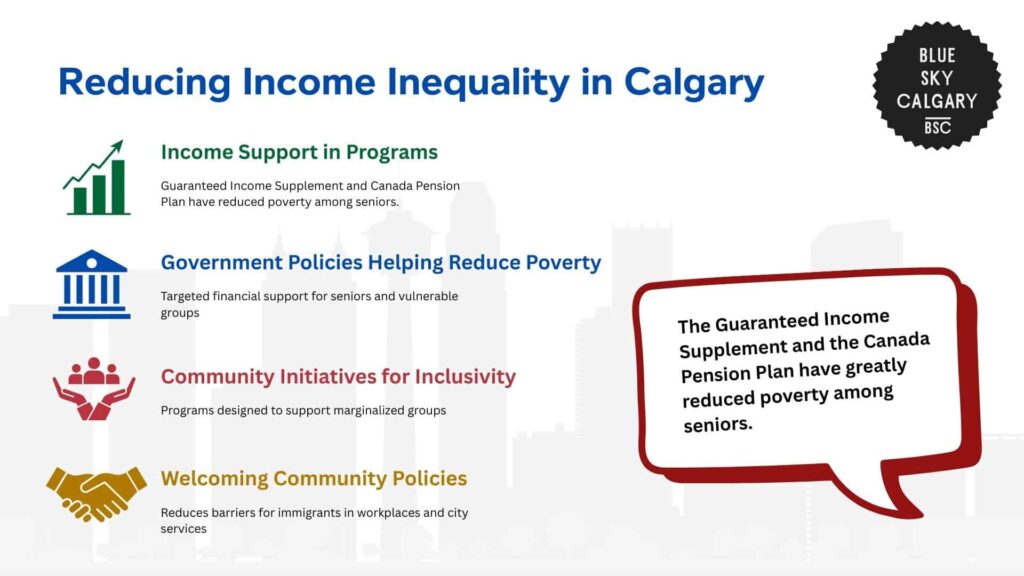
Decreasing poverty in Calgary requires both government policy and action at the community level.
For instance, income supports for seniors like the Guaranteed Income Supplement and the Canada Pension Plan have greatly reduced poverty among seniors.
Today, seniors live in poverty at about half the rate of the rest of Canada’s youth. These results show that when policy is shaped to suit the needs of targeted groups, it can effectively curb economic distress.
Applying the same support to other risk groups, like single mothers, low-income earners, or the disabled, may also help in achieving these positive results.
At the city level, the City of Calgary has embraced inclusion-oriented practices through its Welcoming Community Policy. This policy attempts to minimize structural barriers for immigrants both in the workplace and in city services.
It invites city departments to enhance employability accessibility for immigrant employees, to work with community partners in developing inclusive neighborhoods, and to re-design public services so that they serve immigrant communities better.
These steps seek to ensure economic and social inclusion at the local level by transforming institutional routines that might otherwise exclude marginalized people.
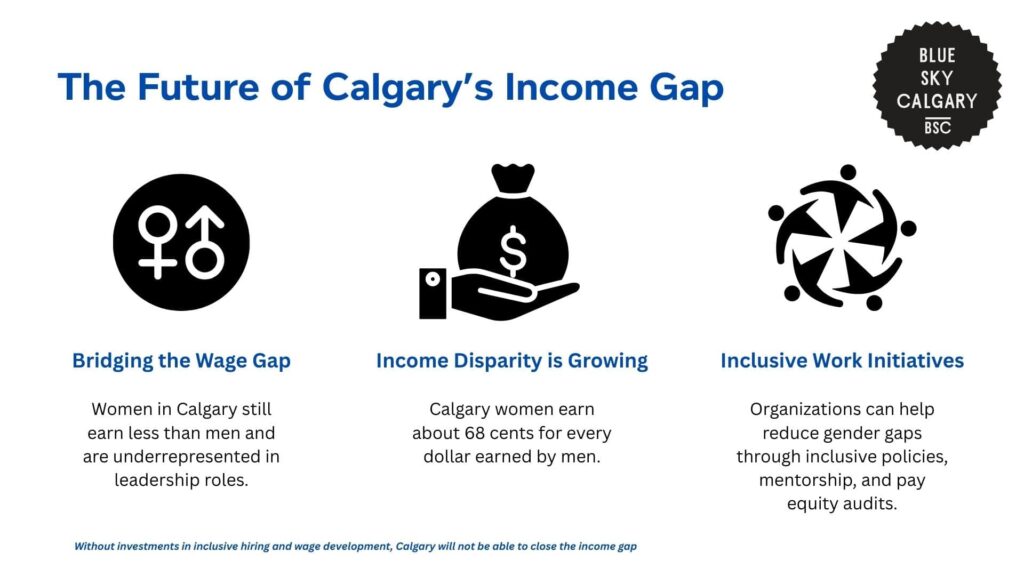
The Future of Income Trends in Calgary
In the future, residents in Calgary may see some increases in their incomes, though not at equal levels for different demographics.
For example, the gender income gap is likely to remain. This is illustrated by the fact that men in Calgary averaged $79,400 in earnings in 2022, whereas women made only $54,300.
If policies on equity in workplaces are not developed to improve women’s wages, then this disparity will not decline.
National numbers also further indicate that the income gap is expanding. The wealthiest 20% of households enjoyed an increase in income of more than $11,000 in 2023, while the lowest 20% only enjoyed a gain of $93.
If this trend continues, Calgary could be headed down the same road, where those at the upper end continue to pull farther ahead while those at the bottom are left behind.
Thus, Calgary’s future income trends will depend on government and community policies.
Investment in inclusive hiring, wage development, and newcomer and low-income support may be able to close the income gap and ensure equitable wages for the city’s residents.
References
- Statistics Canada. (2021). Calgary, Alberta [Census metropolitan area], Alberta and Alberta [Province] (table). Census Profile, 2021 Census of Population. https://www12.statcan.gc.ca/census-recensement/2021/dp-pd/prof/details/page.cfm?Lang=E&GENDERlist=1&STATISTIClist=1&HEADERlist=0&DGUIDlist=2021A00054806016&SearchText=calgary
- City of Calgary. (n.d.). Population profile. https://www.calgary.ca/research/population-profile.html
- Calgary Economic Development. (2021). Calgary wealth fact sheet – 2021 edition. https://www.calgaryeconomicdevelopment.com/assets/Reports/FactSheet-Wealth-2021-Edition-2021-09.pdf
- Government of Alberta. (n.d.). Median family income – Calgary. Alberta Regional Dashboard. https://regionaldashboard.alberta.ca/region/calgary/median-family-income/#/?from=2017&to=2021
- Statistics Canada. (2023). Table 11-10-0239-01: Income statistics by age and sex, Canada, provinces and selected census metropolitan areas. https://www150.statcan.gc.ca/t1/tbl1/en/tv.action?pid=1110023901&pickMembers%5B0%5D=1.19&pickMembers%5B1%5D=2.1&pickMembers%5B2%5D=3.3&pickMembers%5B3%5D=4.1&cubeTimeFrame.startYear=2018&cubeTimeFrame.endYear=2022&referencePeriods=20180101%2C20220101
- Shillington, R. (2024, July). Income and wealth inequality in Canada. Policy Options. https://policyoptions.irpp.org/magazines/july-2024/income-wealth-inequality/
- Statistics Canada. (2024, April 26). Income inequality continues to grow in Canada. The Daily. https://www150.statcan.gc.ca/n1/daily-quotidien/240426/dq240426a-eng.htm
- Food Banks Canada. (2024). Poverty in Canada 2024 report. https://fbcblobstorage.blob.core.windows.net/wordpress/2024/06/FBC_2024PovertyInCanada_ENG_v6.pdf
- Organisation for Economic Co-operation and Development. (2021). Does inequality matter? https://www.oecd.org/en/publications/does-inequality-matter_3023ed40-en.html
- City of Calgary. (n.d.). How to reduce poverty in Calgary. https://www.calgary.ca/content/dam/www/csps/cns/documents/social-research-policy-and-resources/how-to-reduce-poverty.pdf
- City of Calgary. (n.d.). Poverty reduction and support services. https://www.calgary.ca/social-services/low-income/poverty.html
- Government of Canada. (n.d.). Guaranteed Income Supplement. https://www.canada.ca/en/services/benefits/publicpensions/old-age-security/guaranteed-income-supplement.html
- City of Calgary. (n.d.). Welcoming Community Policy. https://www.calgary.ca/communities/newcomers/welcoming-policy.html