Calgary’s Growing Diversity: Population Statistics and Shifts
Key Insights
| The World Population Review indicates that between 2014 and 2025, the population of Calgary grew from 1,323,680 to 1,687,900, by 364,220 people. A report by the Calgary Economic Development provides information on how Calgary experienced high migration inflows in 2023, with a total of 88,078 migrants. Statistics Canada illustrates how Calgary is experiencing higher rates of immigration, with 430,640 immigrants residing within the city. The World Population Review reveals that Calgary has progressively diversified, as 30.1% of its population is from a visible minority. The same report shows that among visible minorities, the largest visible minorities residing in Calgary were South Asians (7.5%), Chinese (6.8%), and Filipinos (4.4%). |
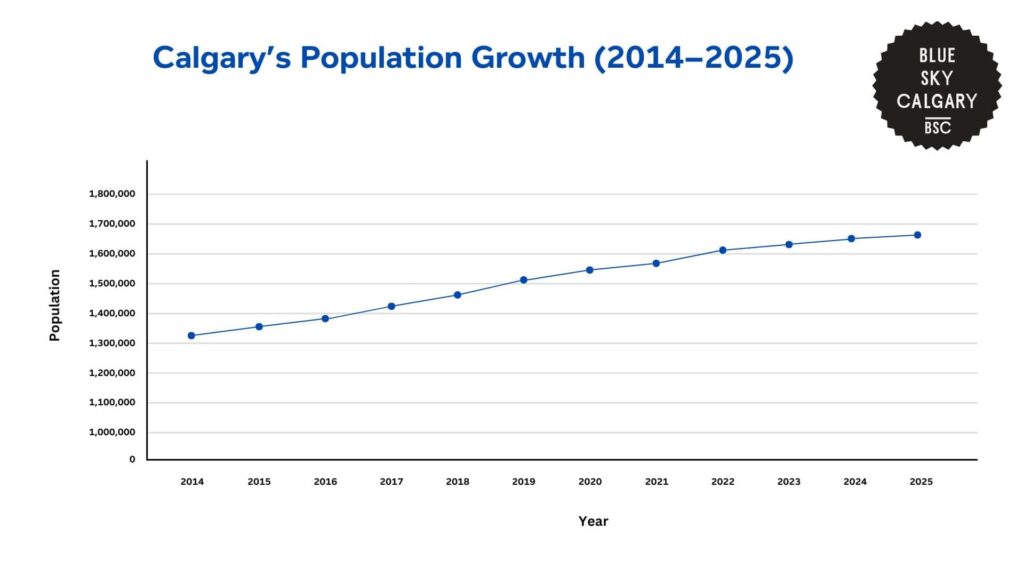
The World Population Review shows that between 2014 and 2025, the population of Calgary increased from 1,323,680 to 1,687,900, by 364,220 individuals.
Calgary’s growth rate was consistent at 2.77% between 2014 and 2018, which brought approximately 37,500 to 39,800 new residents every year.
However, after 2019, the growth rate reduced, down to 1.37% by 2025, with annual additions decreasing to 22,880 new residents.
| Year | Population | Annual Growth Rate (%) | New Residents Added |
| 2014 | 1,323,680 | 2.77% | 35,660 |
| 2015 | 1,360,320 | 2.77% | 36,640 |
| 2016 | 1,398,020 | 2.77% | 37,700 |
| 2017 | 1,436,770 | 2.77% | 38,750 |
| 2018 | 1,476,600 | 2.77% | 39,830 |
| 2019 | 1,512,540 | 2.43% | 35,940 |
| 2020 | 1,547,480 | 2.31% | 34,940 |
| 2021 | 1,580,660 | 2.14% | 33,180 |
| 2022 | 1,611,480 | 1.95% | 30,820 |
| 2023 | 1,639,610 | 1.75% | 28,130 |
| 2024 | 1,665,020 | 1.55% | 25,410 |
| 2025 | 1,687,900 | 1.37% | 22,880 |
Regional Analysis of Diversity Trends Across Canada
The Calgary Economic Development gives insights into migration trends throughout Canada.
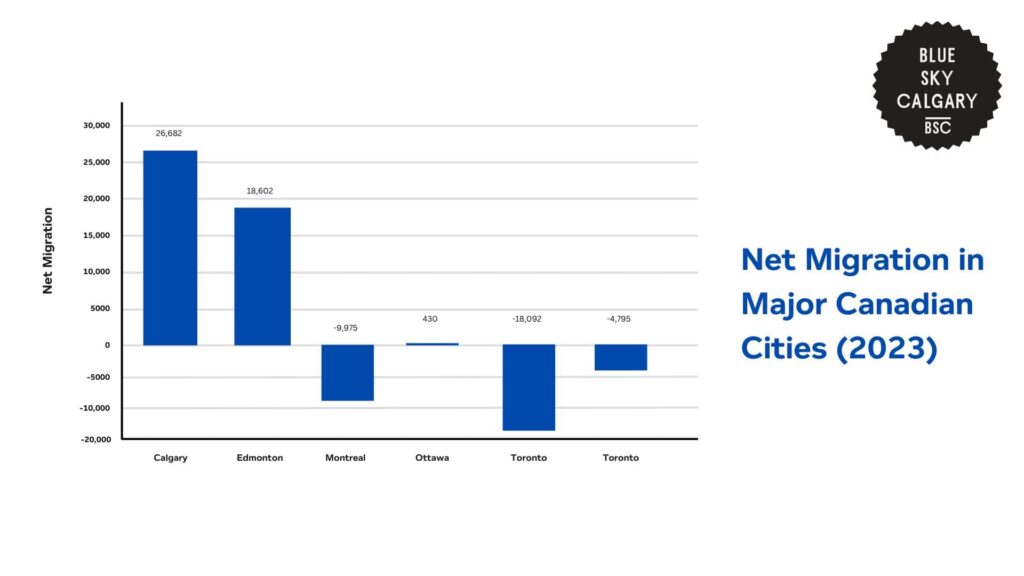
Calgary registered high migration inflows in 2023 with a total of 88,078 migrants, the highest per capita among major Canadian metropolitan areas at 50.3 migrants per 1,000 inhabitants.
The city had a net gain of 26,682 individuals through migration, mostly from international migration, which recorded 60,176 net new residents.
Meanwhile, interprovincial migration added 1,238 net new residents. This illustrates Calgary’s position as a prime destination for international arrivals and domestic relocation.
The city’s net gain of 26,682 individuals is a notable distinction from Toronto, which lost 18,092, and Montreal, which also witnessed a net decrease of 9,975.
Although Calgary’s net international migration of 60,176 remained the largest source of its growth, its net interprovincial migration of 1,238 was less than Edmonton’s 3,085.
However, Calgary performed better than Vancouver and Toronto, which lost 18,399 and 93,024 residents, respectively.
These statistics reflect Calgary’s growing attractiveness, underpinned by economic development, affordability, and increasing job opportunities. These all make it an attractive destination for international migrants and Canadians from other provinces.
| City | Total Migrants | Migrants per 1,000 | Net Migration | Net Interprovincial Migration | Net International Migration |
| Calgary | 88,078 | 50.3 | 26,682 | 1,238 | 60,176 |
| Edmonton | 57,658 | 36.9 | 18,602 | 3,085 | 38,491 |
| Montreal | 122,862 | 27.3 | -9,975 | -20,624 | 12,561 |
| Ottawa | 37,508 | 23.3 | 430 | 5,076 | -4,646 |
| Toronto | 202,058 | 29.7 | -18,092 | -93,024 | 31,174 |
| Vancouver | 116,021 | 39 | -4,795 | -18,399 | 13,215 |
Migration Trends in Calgary
Statistics Canada shows that Calgary has a sizable immigrant population of 430,640 immigrants who live in the city.
This is about one-third of the entire population, and it signifies the city’s status as a top destination for new arrivals.
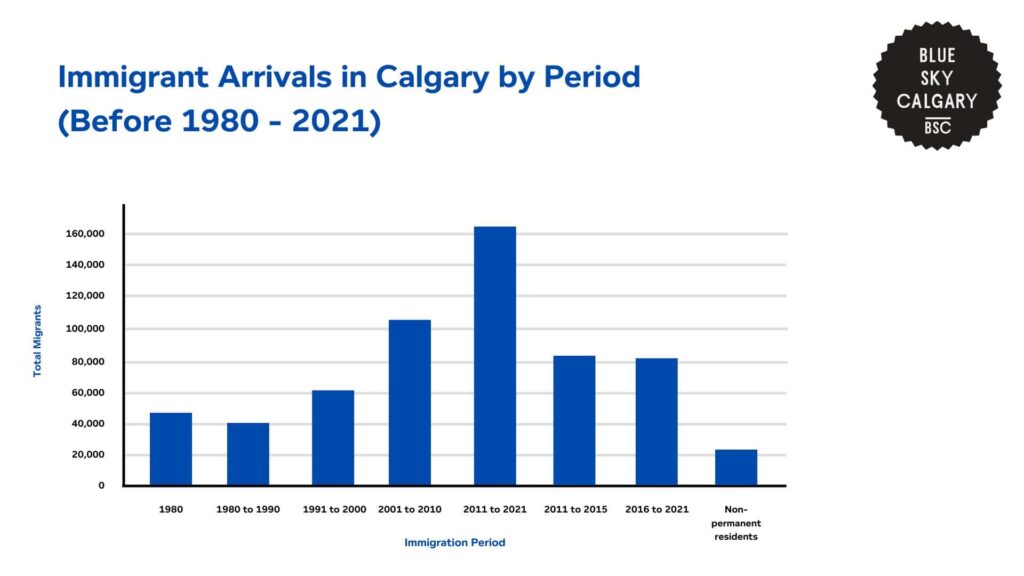
Of Calgary’s immigrant population, 81,315 came between 2016 and 2021, and 82,050 came between 2011 and 2015. In comparison, only 40,330 immigrants came between 1980 and 1990, and only 48,430 came prior to 1980.
Most immigrants, a total of 163,365, arrived between 2011 and 2021, and they make up 38% of the entire immigrant population.
This is a dramatic rise compared to the earlier decades. 117,055 immigrants entered the country between 2001 and 2010, and 61,465 between 1991 and 2000.
The population of non-permanent residents is also noteworthy, with 27,025 residing in Calgary currently, adding to the city’s dynamic demographic makeup.
| City | Total Migrants | Migrants per 1,000 | Net Migration |
| Immigration Period | Total Immigrants | Male | Female |
| Before 1980 | 48,430 | 23,310 | 25,115 |
| 1980 to 1990 | 40,330 | 19,730 | 20,600 |
| 1991 to 2000 | 61,465 | 29,575 | 31,890 |
| 2001 to 2010 | 117,055 | 56,175 | 60,875 |
| 2011 to 2021 | 163,365 | 78,275 | 85,095 |
| 2011 to 2015 | 82,050 | 39,320 | 42,735 |
| 2016 to 2021 | 81,315 | 38,960 | 42,360 |
| Non-permanent residents | 27,025 | 14,085 | 12,940 |
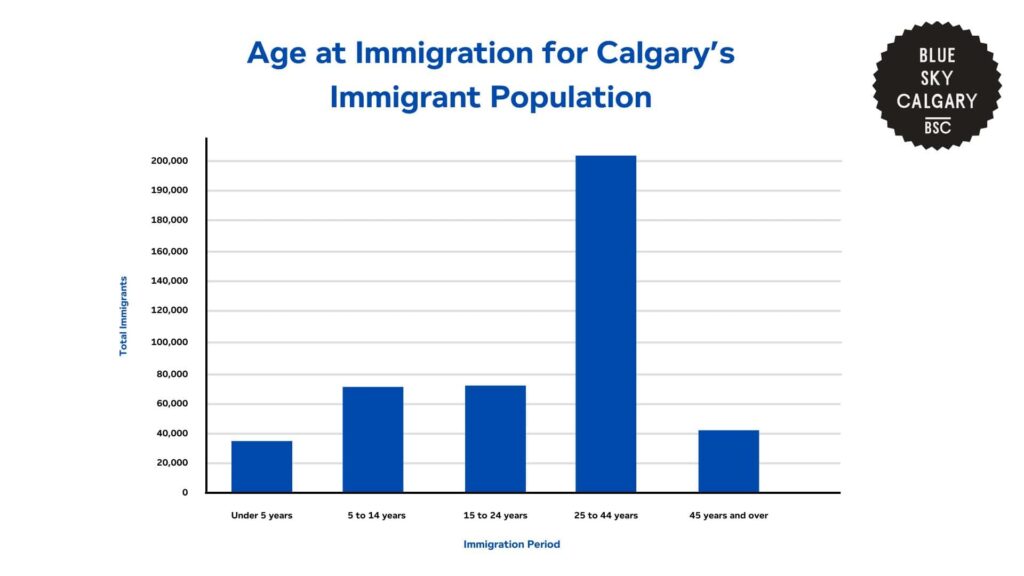
The data also shows that Calgary’s immigrant population differs considerably by age at arrival, which has an impact on their economic and social integration.
The majority is comprised of 204,525 immigrants who came between the ages of 25 and 44, representing 47.5% of all immigrants.
This indicates that Calgary is viewed by immigrants as an economic hub, with working-age individuals coming for job opportunities.
Furthermore, 74,550 immigrants came in the age group of 15 to 24 years, and 71,460 immigrated as children in the age group of 5 to 14 years. This further reflects a consistent flow of young immigrants into the city’s education system and workforce.
Meanwhile, there are fewer immigrants from older age groups. 43,060 immigrants came aged 45 years and above and account for just 10% of all immigrant arrivals.
However, it is actually the youngest group, aged below 5 years old, that has the smallest number of immigrants. This group comprises only 37,050 individuals.
| Age Group at Immigration | Total Immigrants | Male | Female |
|---|---|---|---|
| Under 5 years | 37,050 | 18,960 | 18,090 |
| 5 to 14 years | 71,460 | 37,200 | 34,265 |
| 15 to 24 years | 74,550 | 34,020 | 40,525 |
| 25 to 44 years | 204,525 | 97,045 | 107,480 |
| 45 years and over | 43,060 | 19,840 | 23,220 |
Demographic Trends in Calgary
Calgary’s population of 1,687,900 in 2025 reflects a diverse and evolving demographic landscape shaped by age distribution, ethnicity, and household composition.
The World Population Review reports on diversity trends among different demographics in Calgary.
Ethnic Composition and Languages Spoken in Calgary
The population of Calgary has become increasingly racially diversified, with 30.1% of its residents coming from a visible minority.
More than 200 ethnic origins were listed among Calgary’s inhabitants, with usual ancestral origins being English, Scottish, Canadian, German, and Irish.
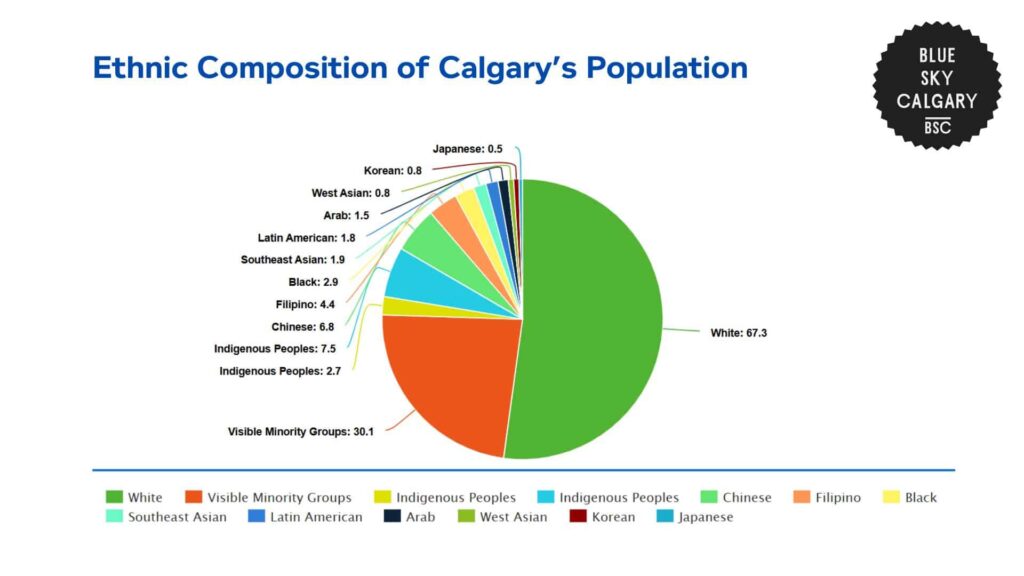
The largest ethnic group is White at 67.3%, though this figure has been declining continuously as more and more immigrants come from non-European nations.
Indigenous people comprised 2.7% of the population. Of visible minorities, the largest groups were South Asians (7.5%) and Chinese (6.8%), then Filipinos (4.4%).
The other increasing visible minority groups are Black residents (2.9%), Southeast Asians from other countries (1.9%), Latin Americans (1.8%), and Arabs .⅕%).
These constitute both established immigrant communities and emerging migration patterns.
| Ethnic Group | Percentage of Population |
| White | 67.30% |
| Visible Minority Groups | 30.10% |
| Indigenous Peoples | 2.70% |
| South Asian | 7.50% |
| Chinese | 6.80% |
| Filipino | 4.40% |
| Black | 2.90% |
| Southeast Asian | 1.90% |
| Latin American | 1.80% |
| Arab | 1.50% |
| West Asian | 0.80% |
| Korean | 0.80% |
| Japanese | 0.50% |
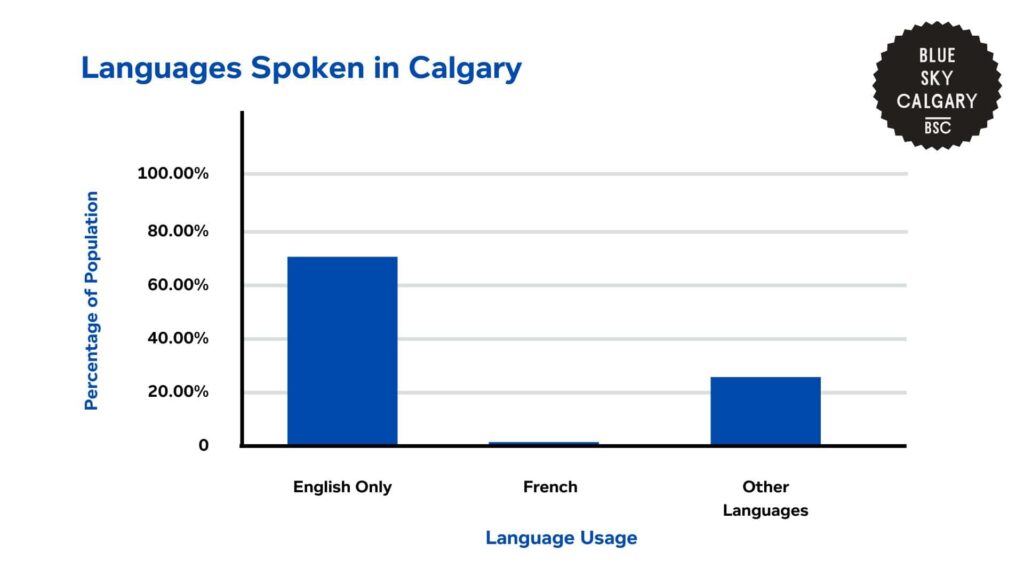
Most Calgary citizens use English as their first language, and about 70% of the population uses only English on a day-to-day basis.
Canada’s second official language, French, is spoken by only 1% of the population, reflecting that Calgary is still a predominantly English-speaking city.
However, 25% of residents report speaking their native language after immigrating, showing Calgary’s linguistic diversity alongside its ethnic composition.
The most widely spoken non-official languages in Calgary are Punjabi, Tagalog, Cantonese, Mandarin, and Spanish, which represent the largest immigrant groups.
These languages are dominant in homes, enterprises, and cultural organizations throughout the city.
| Language Usage | Percentage of Population |
| English Only | 70.00% |
| French | 1.00% |
| Other Languages | 25.00% |
Religious Affiliation in Calgary
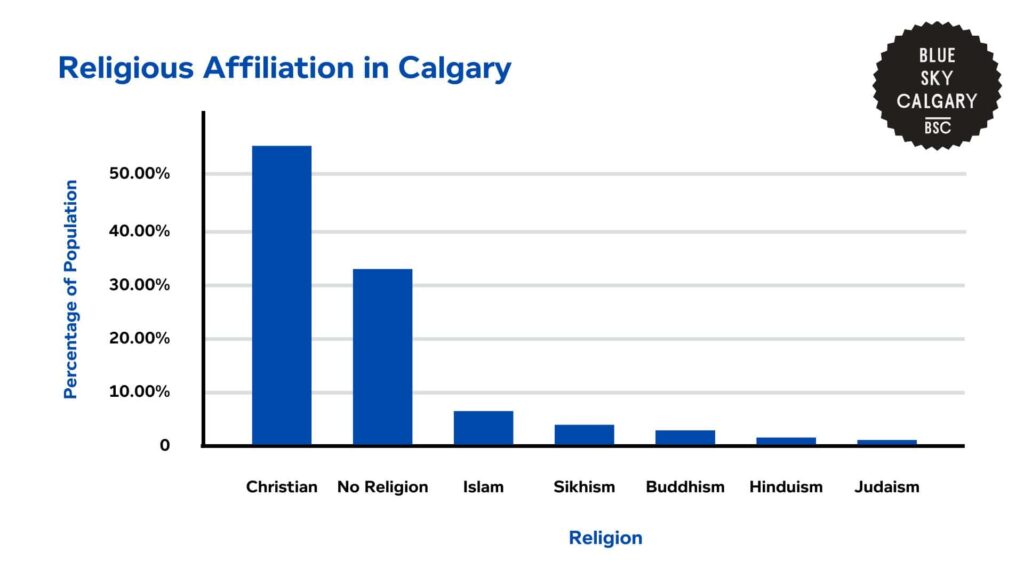
Christianity is still the prevailing religion in Calgary, with 55% of the population identifying as Christian, encompassing different denominations like Catholic, Protestant, and Orthodox Christian groups.
However, secularism is on an upward trend, with 32% of the population having no religious belief. This reflects a broader change in social and cultural trends and is in line with larger national trends.
Among religions other than Christianity, the most practiced religion is Islam at 5.2% of the population, then Sikhism at 2.6%, Buddhism at 2.1%, Hinduism at 1.6%, and Judaism at 0.6%.
This occurrence is attributed to the ethnic diversification happening in Calgary through the immigration process, mainly from South Asia, the Middle East, and Southeast Asia.
| Religion | Percentage of Population |
| Christian | 55.00% |
| No Religion | 32.00% |
| Islam | 5.20% |
| Sikhism | 2.60% |
| Buddhism | 2.10% |
| Hinduism | 1.60% |
| Judaism | 0.60% |
Costs and Consequences of Demographic Shifts in Calgary
The World Economic Forum highlights how rapid population growth and demographic shifts in Calgary have caused some issues for the city.
Housing Affordability and Supply Constraints
The city’s fast-paced population growth has compounded issues with housing affordability and availability.
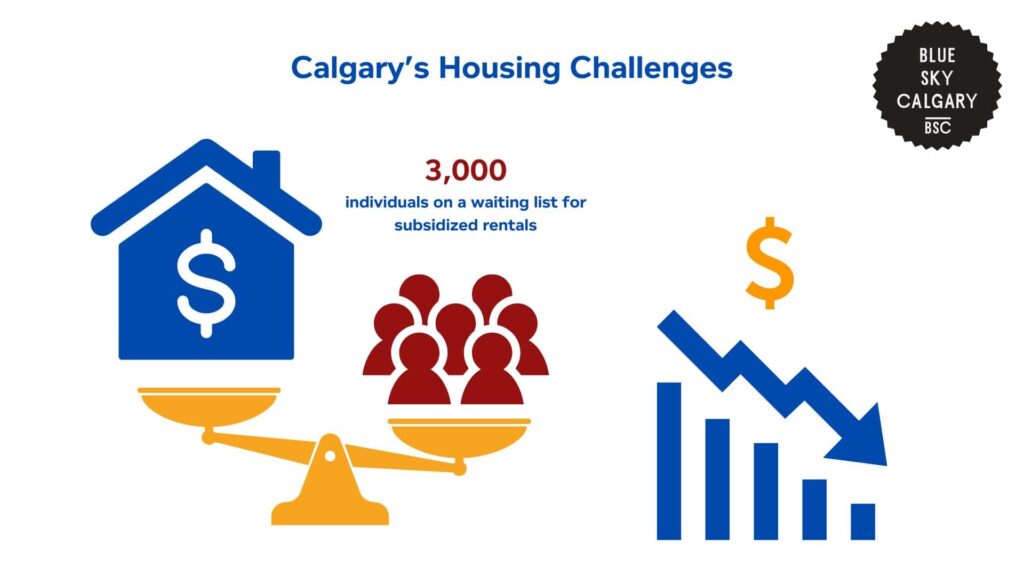
Rental units are costly, with 3,000 individuals on a waiting list for subsidized rentals with the Calgary Housing Company. Scarce supply and increasing demand have driven rental costs up, which has been hardest on low-income families and immigrants.
As the city expands, making housing affordable is a pressing concern. Government programs, including rent subsidies and expanded housing stock, are intended to stem the crisis, but demand continues to exceed supply.
The pressure on housing also has economic implications as more residents are pushed into longer commutes, crowded living arrangements, or financial insecurity because of high housing expenses.
Education and Language Barriers for Migrants
The migration of foreign migrants has put pressure on Calgary’s education system, especially in assisting students with language barriers.
A portion of new immigrants come into the city with lower English skills, which creates a challenge for them to integrate into the mainstream school system.
Statistics Canada shows that only 11% of university-educated recent immigrants reached level 4 and 5 in English prose literacy proficiency, compared to 37% of Canadian-born graduates.
Furthermore, some international students also have a distinct educational background that does not match Canada’s education system. Thus, they may need special programs for academic support.
In turn, Calgary’s public school board has established migrant schools offering intensive English-language instruction and services for those with lower levels of education.
However, the need for these resources continues to grow, requiring more funding, staff, and infrastructure to keep up with demand.
Without adequate educational support, young migrants may struggle with academic achievement, limiting their future economic opportunities.

Urban Planning and Infrastructure Strain
Calgary’s population growth has caused fiscal pressure on city development. For example, development in Calgary’s outer districts involves a major investment in infrastructure, such as roads, utilities, and mass transit.
Moreover, urban sprawl costs have hindered the construction of inner-city infrastructure, raising concerns about sustainability and the effective use of city resources.
If left uncontrolled, sprawl would drive up the cost of transportation, make the commute longer, and necessitate increased taxes to provide services in far-flung regions.

Interventions and Solutions
Attainable Homes Calgary Corporation (AHCC) is a not-for-profit organization created to fill the gap between renting and owning for moderate-income Calgarians.
AHCC provides below-market ownership through collaboration with builders, developers, lenders, and the government.
Qualified participants are provided with down payment assistance, allowing them to buy homes with a small initial investment.
This project responds to the challenge that, as of 2022, about 20% of Calgary households are spending over 30% of their income on housing, qualifying as a household in need of affordable housing.
Meanwhile, the Alex Pathways to Housing program uses the Housing First model, in which it provides direct housing without conditions to those suffering from chronic homelessness.
This is supported by integrated support services such as healthcare, mental health services, and counseling for substance abuse.
The Future of Diversity Trends in Calgary
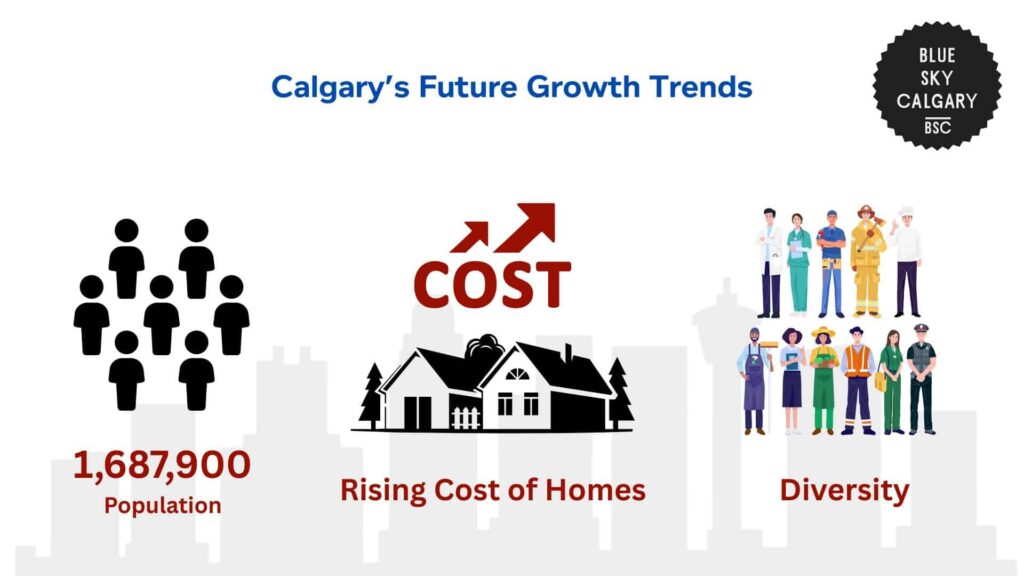
Calgary’s population is projected to reach 1,687,900 by 2025, continuing its upward trend but at a slower rate than in previous years.
Migration will continue to be a dominant driver of this growth, with visible minorities contributing a larger percentage of the population. This growth in diversity will influence the workforce, education sector, and housing demand in the city.
Moreover, issues in housing affordability are likely to continue, with 20% of Calgary homes now paying more than 30% of their household income towards housing.
If there are no additional interventions, there is a possibility that demand for affordable housing might exceed supply. As a result, the financial burden for residents will increase.
Spending on infrastructure, especially in terms of public transport and high-rise housing, will be needed in order to take in growth.
Without careful planning, Calgary is at risk for more congestion, longer travel times, and more expensive living.
References
- Attainable Homes Calgary. (n.d.). Attainable Homes Calgary Corporation. Retrieved March 7, 2025, from https://attainyourhome.com/
- Calgary Economic Development. (n.d.). Demographics. Retrieved March 7, 2025, from https://www.calgaryeconomicdevelopment.com/insights/demographics/
- Statistics Canada. (2021). Census Profile, 2021 Census – Calgary. Government of Canada. Retrieved March 7, 2025, from https://www12.statcan.gc.ca/census-recensement/2021/dp-pd/prof/details/page.cfm?Lang=E&GENDERlist=1,2,3&STATISTIClist=1&HEADERlist=0&DGUIDlist=2021A00054806016&SearchText=calgary
- The Alex. (n.d.). Housing programs. Retrieved March 7, 2025, from https://www.thealex.ca/program/housing-programs/
- World Economic Forum. (n.d.). Migration and its impact on cities. Retrieved March 7, 2025, from https://www3.weforum.org/docs/WEF_Migration_Report_Embargov.pdf
- World Population Review. (2025). Calgary population 2025. Retrieved March 7, 2025, from https://worldpopulationreview.com/canadian-cities/calgary-population
- Statistics Canada. (2005). Literacy performance of immigrants in Canada: Results from the International Adult Literacy and Skills Survey (IALSS). Government of Canada. Retrieved March 7, 2025, from https://www150.statcan.gc.ca/n1/pub/81-004-x/2005005/9112-eng.htm


