Breaking Down Crime in Calgary: Trends, Statistics, and Future Projections
Key Insights
| As per the Calgary Police Service Report, the city experienced a total of 3,373 violent crimes in the first quarter of 2024, which is 2.5% higher than the city’s five-year average of 3,290 cases per year. The report also found that assault cases reflected mixed trends, with overall assault cases decreasing by 2% from 2,302 cases in Q1 2023 to 2,256 cases in Q1 2024, but increasing by 5.2% when compared to the five-year average. Statistics Canada reveals that based on the Crime Severity Index (CSI) values of regions in Canada, Alberta’s CSI of 103.0 in 2023 fell by 2% from 2022. Data from My Calgary shows that based on the number of reported offenses annually in Calgary, Bel-Aire and Diamond Cove are the safest neighborhoods in the city, each with only four crimes in 2024. The Calgary Police Commission’s Calgary Race Data Analysis indicates that Indigenous individuals are disproportionately victimized, experiencing 2.5 times higher rates of crime compared to their relative proportion of the population. |
According to the Calgary Police Service Report, the city saw increases in certain crime categories during the first quarter of 2024.
Overall, the city recorded 3,373 violent crimes during this period, which is an increase of 2.5% over the five-year average of 3,290 cases. However, this is also a decline of 4.1% when compared to the Q1 2023 total of 3,516 cases.
| Crime Category | Q1 2023 Cases | Q1 2024 Cases | Five-Year Average (2019 – 2023) | % Change (Q1 2024 vs. 5-Year Average) | % Change (Q1 2024 vs. Q1 2023) |
| Total Violent Crime | 3,516 | 3,373 | 3,290 | +2.5% | -4.1% |
| Assault (All Types) | 2,302 | 2,256 | 2,145 | +5.2% | -2.0% |
| Aggravated Assault | 40 | 13 | 30 | -56.7% | -67.5% |
| Common Assault | 1,416 | 1,437 | 1,337 | +7.5% | +1.5% |
| Assault on Police | 88 | 108 | 88 | +22.7% | +22.7% |
| Homicide | 3 | 5 | 5 | 0% | +66.7% |
| Attempted Homicide | 2 | 4 | 2 | +100% | +100% |
| Sexual Offences | 331 | 297 | 339 | -12.3% | -10.3% |
| Robbery | 262 | 230 | 263 | 12.6% | 12.6% |
| Personal Robbery | 175 | 142 | 152 | -6.5% | -18.9% |
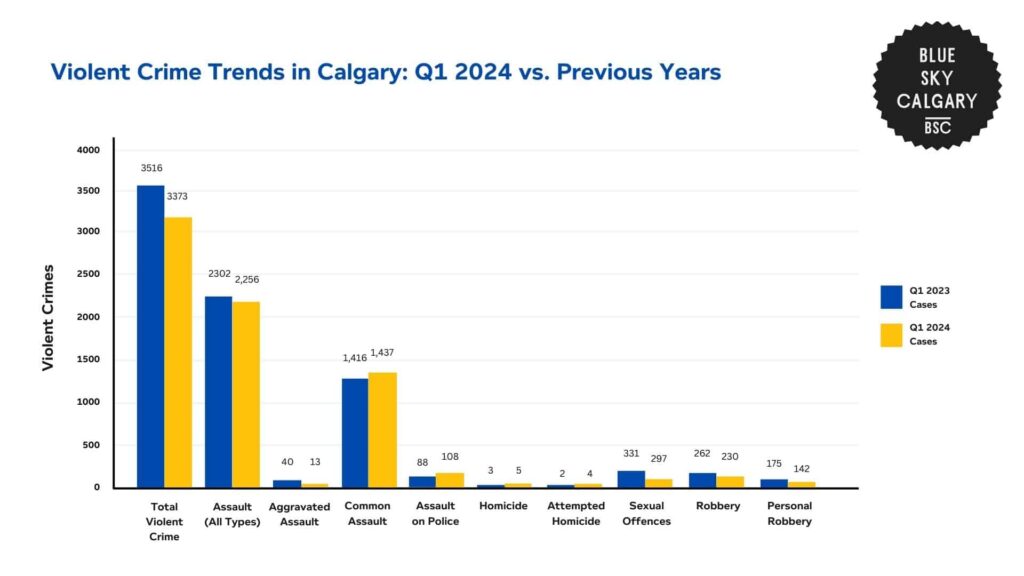
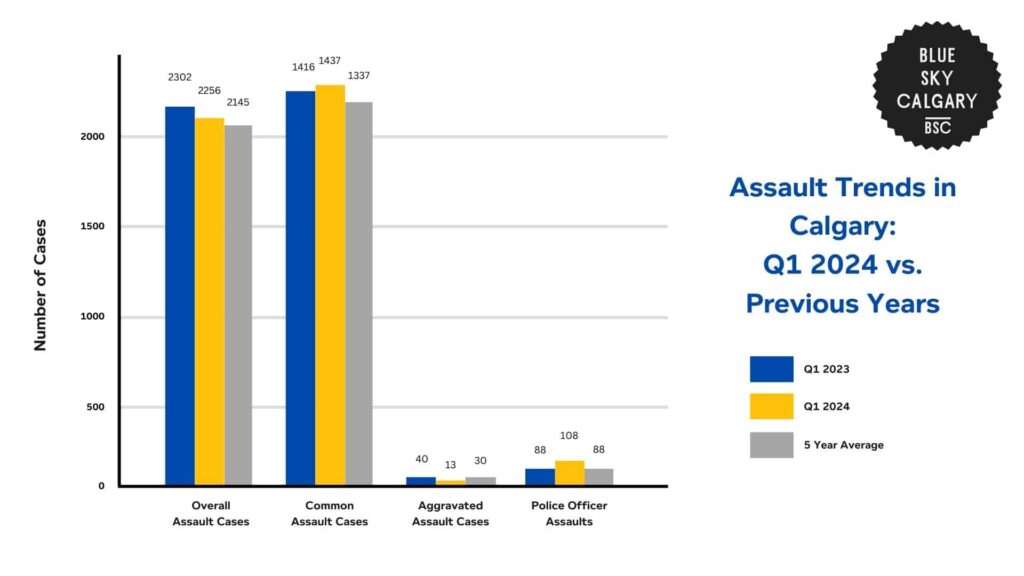
The results from assault cases show mixed trends for Q1 2024 as overall assault cases dropped by 2% from 2,302 cases in Q1 2023 to 2,256 cases in Q1 2024. However, this number is 5.2% higher than the five-year average of 2,145 cases.
Under this, common assault cases increased by 1.5%, rising from 1,416 cases in Q1 2023 to 1,437 cases in Q1 2024. This is a 7.5% increase when compared to the five-year average of 1,337.
Aggravated assault cases fell sharply by 67.5% from the previous year, with 13 cases reported in Q1 2024 compared to the 40 cases in Q1 2023. This number is also 56.7% lower than the five-year average of 30 cases.
Meanwhile, assaults on police officers rose by 22.7% from the previous year, with 108 cases in Q1 2024 and 88 cases in Q1 2023. This also happens to align with the five-year average of 88 cases.
Homicide cases increased in Q1 2024, with 5 cases reported, compared to the 3 cases in Q1 2023, marking a rise of 66.7%. This figure also aligns with the five-year average of 5 homicides.
Moreover, attempted homicides doubled, rising from 2 cases in Q1 2023 to Q1 2024. This is 100% higher when compared to both the previous year and the five-year average.
However, it is important to note that these figures show a sharp increase due to the smaller raw numbers for homicide cases.
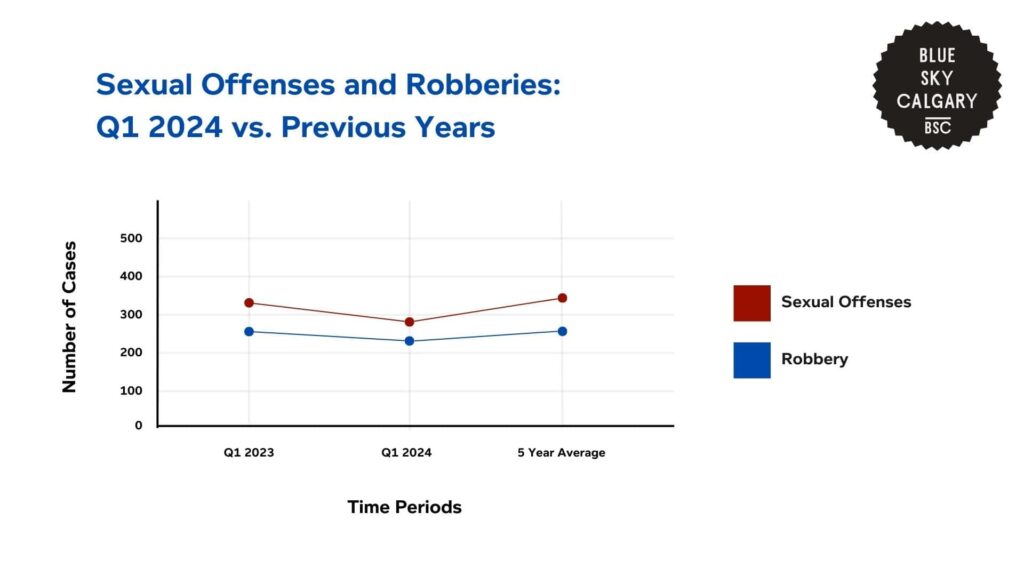
Sexual offenses showed a notable decrease of 10.3%, with 331 cases in Q1 2023 and 297 cases in Q1 2024. This is also 12.3% lower than the five-year average of 339 cases.
Robbery cases also declined by 12.6%, falling from 262 cases in Q1 2023 to 230 cases in Q1 2024. This is also 12.6% lower than the five-year average of 263 cases.
Specifically, personal robberies saw an 18.9% decrease, with 142 cases reported in Q1 2024 compared to 175 cases in Q1 2023.
Crime Severity Across Regions in Canada
Statistics Canada reports on the Crime Severity Index (CSI), across regions and measures the volume and severity of police-reported crimes.
Alberta, Calgary’s province, tends to follow the national pattern with shifts in violent and non-violent offenses.
| Region | CSI Value (2023) | Change from 2022 |
| Canada (National Average) | 80.5 | +2% |
| Alberta | 103.0 | -2% |
| British Columbia | 104.1 | -4% |
| Ontario | 60.9 | +4% |
| Quebec | 62.2 | +3% |
| Manitoba | 145.5 | -1% |
| Saskatchewan | 106.2 | +2% |
| Northwest Territories | 473.7 | +5% |
| Nunavut | 429.1 | +12% |
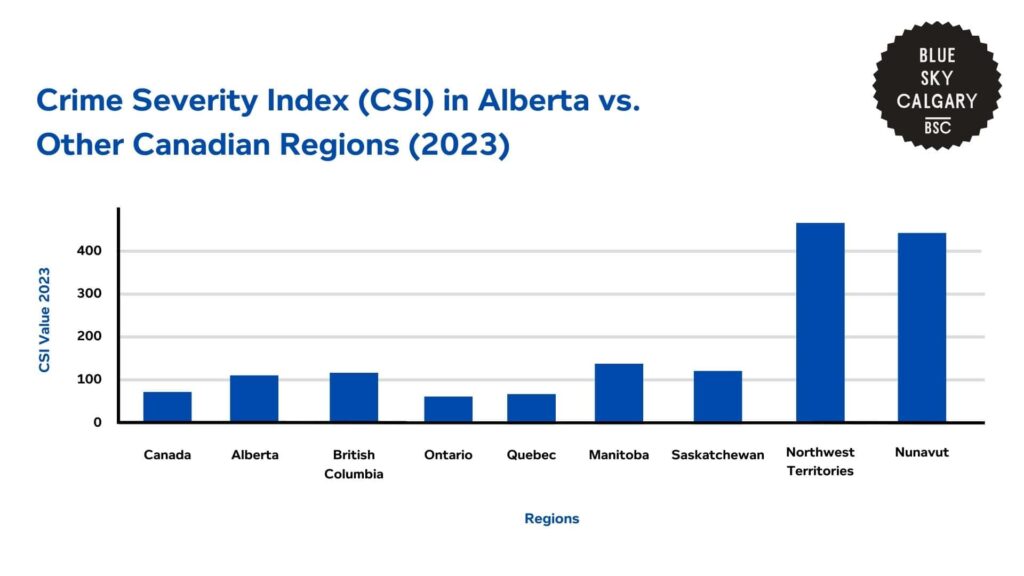
While crime rates fluctuated throughout the country, Alberta’s CSI of 103.0 declined by 2% from 2022. Calgary mirrors these trends with varied shifts in violent and non-violent crimes.
Alberta’s CSI is 28% higher than the national average of 80.5, indicating that crime in the province is more severe and frequent compared to other regions.
Furthermore, this number is higher than other large regions like Ontario and Quebec, which have CSI values of 60.9 and 62.2 respectively. These values are 39% and 40% lower than Alberta’s CSI.
Meanwhile, British Columbia’s CSI of 104.1 has a nearly identical CSI to Alberta, but experienced a sharper decline of 4% from 2022 to 2023, indicating a stronger improvement in crime severity.
Compared to Canada’s northern territories, Alberta’s crime severity is significantly lower. The Northwest Territories and Nunavut have CSIs of 473.7 and 429.1, which are around 4 times higher than Alberta’s CSI.
These trends highlight that while Alberta still faces crime rates that are higher than the national average, its recent decline suggests moderate improvements relative to national and regional shifts.
Top 10 Safest Neighborhoods in Calgary
Data from My Calgary shows that crime rates vary across neighborhoods in Calgary. By looking at annual crime per capita and total reported crimes, it is possible to identify the safest communities.
| Rank | Community | Crimes in January 2024 | Total Annual Crimes in 2024 |
| 1 | Bel-Aire | 1 | 4 |
| 2 | Diamond Cove | 0 | 4 |
| 3 | Point McKay | 2 | 7 |
| 4 | Garrison Green | 1 | 9 |
| 5 | Currie | 1 | 11 |
| 6 | Rideau Park | 1 | 11 |
| 7 | Bayview | 2 | 12 |
| 8 | Roxboro | 2 | 12 |
| 9 | Britannia | 1 | 13 |
| 10 | Greenwood-Greenbriar | 2 | 13 |
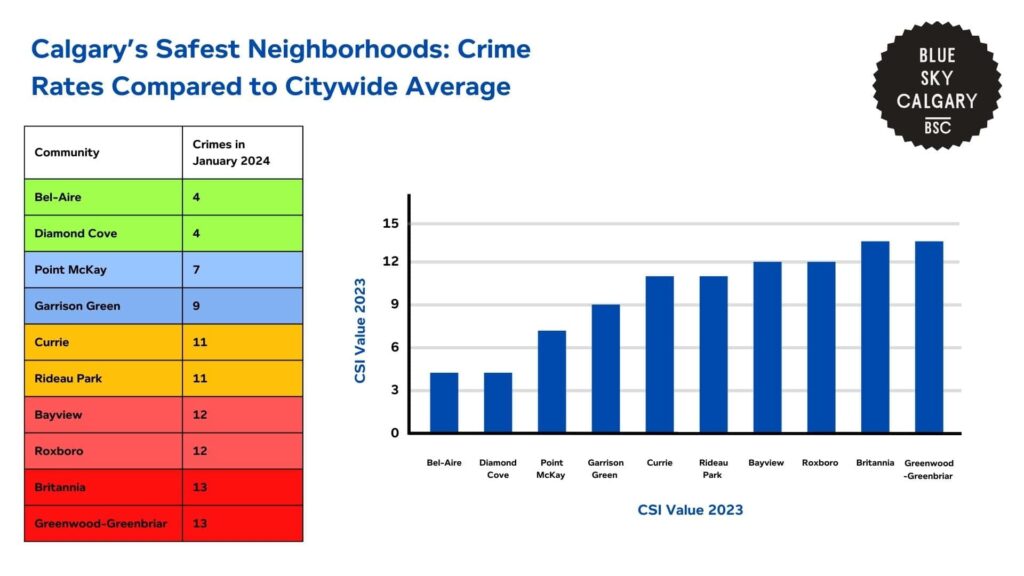
Based on the total number of reported crimes per year, Bel-Aire and Diamond Cove stand out as the safest neighborhoods in the city, each recording just four crimes in 2024.
These two areas report 99.2% fewer crimes than the citywide average for total annual crimes per neighborhood in 2024, which is 44 reported crimes.
When breaking down these numbers based on quadrants within Calgary, the southern area contains the neighborhoods with the lowest crime rates in the city. Bel-Aire and Diamond Cove belong in South West and South East Calgary respectively.
Meanwhile, North West Calgary contains Point McKay, which reported a total of 7 crimes in 2024. This is 98.7% less than the citywide average. Similarly, Greenwood Briar, which reported 13 crimes, is 97.5% lower than the citywide average.
In North East Calgary, crime rates tend to be higher overall, though some neighborhoods in this quadrant are still among the safest in the city. This includes Roxboro, which recorded only 12 crimes and is 97.7% lower than the city average.
Disproportionate Effects of Crime on Race
The 2023 Calgary Race Data Analysis by the Calgary Police Commission reveals that crime in the city affects different demographic groups disproportionately.
| Demographic Group | Population Share (2023) | Victim Count (2022) Victim Count | Victim Count (2023) | % Change | Occurrence Count (2022) | Occurrence Count (2023) | % Change |
| Black | 5.8% | 858 | 997 | +16.2% | 908 | 1,059 | +16.6% |
| Indigenous | 3.3% | 1,037 | 1,170 | +12.8% | 1,324 | 1,435 | +8.4% |
| Racialized | 36.8% | 3,105 | 3,510 | +13.0% | 3,060 | 3,488 | +14.0% |
| White | 54.1% | 5,843 | 6,287 | +7.6% | 6,058 | 6,455 | +6.6% |
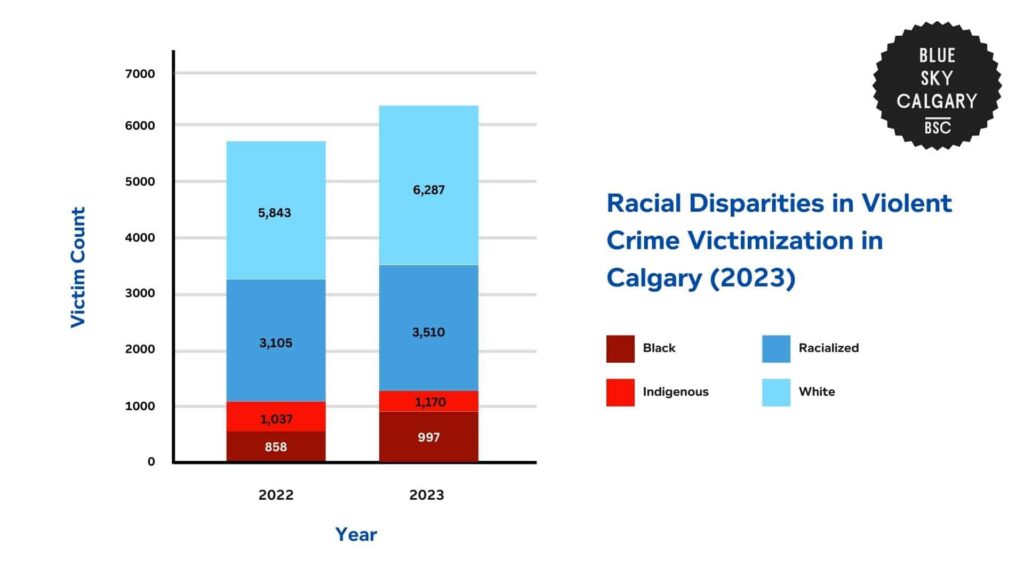
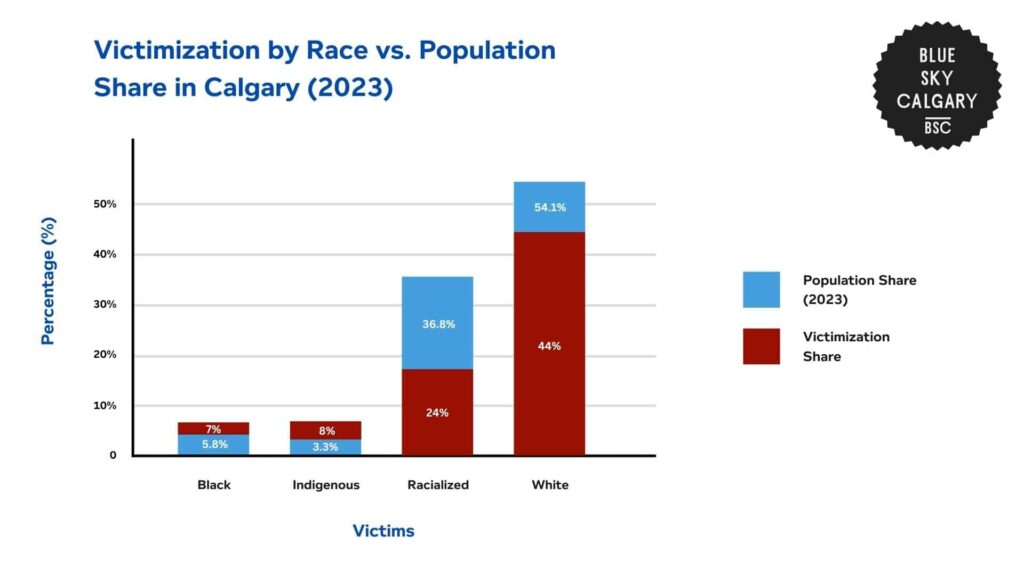
Out of all the crime victims in Calgary in 2023. 44% were white, 24% were racialized, 8% were indigenous, and 7% were black.
Indigenous persons were disproportionately victimized, with 2.5 times higher rates of violent crime faced when compared to their relative population proportion, which is only 3.3% of Calgary’s population.
Although white and black persons recorded crime victimization rates equal to their population, racialized persons were underrepresented in relation to their demographic proportion of 36.8% in Calgary.
Meanwhile, trends in victimization from the last five years also indicate significant changes in patterns across racialized groups.
For example, Indigenous victims rose by 12.8% from 1,037 in 2022 to 1,170 in 2023. The count of occurrences of crimes against Indigenous people rose by 8.4% from 1,324 to 1,435 cases.
However, crimes against black victims experienced an even sharper rise at 16.2%, from 858 victims in 2022 to 997 in 2023. Moreover, crime occurrences involving black victims rose by 16.6%, from 908 to 1,059 victims during the same time period.
Conversely, cases against victims grew by just 7.6% from 5,843 cases in 2022 to 6,287 in 2023, which also reflects the steadier long-term trend.
The largest increase was seen among racialized victims, as numbers rose by 13% from 3,105 cases in 2022 to 3,510 in 2023.
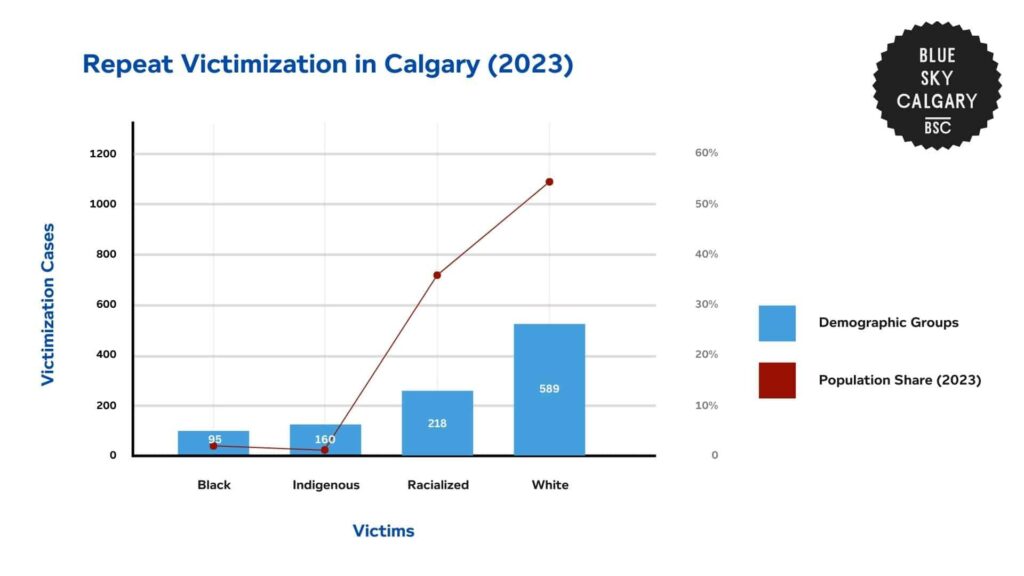
From this, the report finds that repeat victimization is also a pressing concern in Calgary. In 2023, 1062 individuals (9% of all victims) were victimized more than once.
From these numbers, 14% of Indigenous victims experienced multiple victimizations, which significantly exceeds the overall repeat victimization rate of 9%.
Among the 1,062 repeat victims, 589 were white, 218 were racialized, 160 were indigenous, and 95 were black.
When considering their population proportion, the report found that Indigenous and black populations face a disproportionately higher likelihood of experiencing multiple violent incidents.
Costs and Consequences of Crime in Calgary
Public Safety Canada reports on the costs of crime and criminal justice in Canadian cities like Calgary.
The report shows that crime in Calgary has extensive impacts beyond monetary losses, influencing economic stability, social cohesion, and general perceptions of public safety.
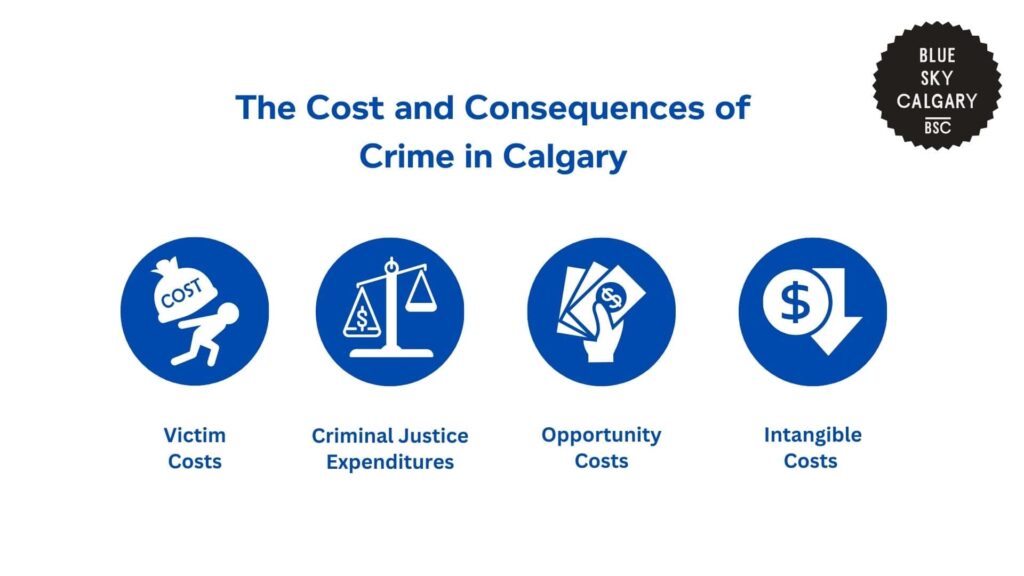
For example, the economic costs of crime include property loss, medical costs, lost productivity, and higher public expenditure on law enforcement, judicial procedures, and prisons.
Nationally, crime-related spending was estimated at $100 billion a year. In Calgary, these costs include higher municipal expenditure on policing, community intervention programs, and social services that target the causes of criminal activity.
In addition to economic effects, crime also influences the public and collective well-being of the population.
Even after shootings decreased by 30% from 2022 to 2023, citizens in Calgary remained anxious regarding safety, especially in high-population areas in the city.
Furthermore, these fears regarding crime rates caused decreased pedestrian traffic in some areas, lower property value, and local business changes, further impacting the economic activity in the city.
Interventions and Solutions to Crime in Calgary
Calgary utilizes diverse strategies for crime prevention, mainly through social development, community outreach, and strategic policing.
The City of Calgary’s Crime Prevention Investment Plan (CPIP) is a funding approach that targets the underlying social and economic roots of crime.
The CPIP focuses on evidence-based initiatives that target early identification and reoffending prevention. The strategy funds social development programs to reduce risk factors and decrease criminal behavior.
Meanwhile, the Calgary Police Service’s Crime Prevention Programs are aimed at crime prevention by way of research, education, and collaboration. They create and administer programs aimed at issues like fraud, theft, crime, robbery, and drugs.
Under this, the Crime Prevention Through Environmental Design Program addresses the alteration of physical environments to discourage criminal behavior. This includes the improvement of natural surveillance, access control, and territorial reinforcement.

The Future of Crime in Calgary
As Calgary grows and develops, the City of Calgary projects that patterns of crime are likely to adapt to economic, technological, and social shifts.
This trend indicates that while some types of violent crimes like homicide are diminishing, other crimes like property offenses, fraud, and cybercrime could continue to rise over the years.
With this, financial crimes and identity theft, in the face of growing technology, are likely to increase the most. Thus, there is a need for law enforcement agencies and policymakers to respond accordingly.
The increasing use of smart city technology, AI surveillance, and predictive policing stand to be more effective at preventing crime. However, these also call into question problems with privacy and data use.
While Calgary has seen success in diminishing crime through neighborhood-based initiatives and evidence-based prevention programs, emerging challenges will call for more innovative policies like cross-agency cooperation and investment in infrastructure.
By emphasizing early intervention, social equity, and technology-enabled crime reduction, Calgary will be able to aim for a safer and more crime-resilient city for its residents.

References
- Calgary Police Service. (2024). Calgary police statistical reports. Retrieved from https://www.calgary.ca/cps/statistics/calgary-police-statistical-reports.html
- Statistics Canada. (2024). Police-reported crime statistics in Canada, 2023. Retrieved from https://www150.statcan.gc.ca/n1/pub/11-627-m/11-627-m2024030-eng.htm
- My Calgary. (2024). Safest Calgary neighborhood report. Retrieved from https://mycalgary.com/city/safest-calgary-neighborhood-report/
- Calgary Police Commission. (2024). Race-based data analysis report. Retrieved from https://www.calgarypolicecommission.ca/wp-content/uploads/2024/09/Agenda-Item-6.1-Report-Race-based-Data-Analysis.pdf
- Public Safety Canada. (2015). Measuring the impact of crime in Canada. Retrieved from https://www.publicsafety.gc.ca/cnt/rsrcs/pblctns/2015-r022/index-en.aspx
- City of Calgary. (2024). Crime Prevention Investment Plan. Retrieved from https://www.calgary.ca/social-services/funding/crime-prevention-investment-plan.html
- Calgary Police Service. (2024). Crime prevention programs and resources. Retrieved from https://www.calgary.ca/cps/community-programs-and-resources/crime-prevention/crime-prevention.html
- Calgary Police Service. (2024). Crime prevention through environmental design (CPTED). Retrieved from https://www.calgary.ca/cps/community-programs-and-resources/crime-prevention/crime-prevention-through-environmental-design.html
- City of Calgary. (2024). Official city website. Retrieved from https://www.calgary.ca/home.html
- Calgary Police Service. (2024). Identity crime prevention resources. Retrieved from https://www.calgary.ca/cps/community-programs-and-resources/crime-prevention/identity-crime.html
- Calgary Police Service. (2024). Calgary Police Service official website. Retrieved from https://www.calgary.ca/cps.html


