
Calgary’s Employment Landscape: Statistics, Trends, and Economic Impact

Key Insights
| Data from the Labour Market Review reveals that Calgary has a total working-age population of 88,500 individuals. According to Statistics Canada, Calgary’s employment rate declined to 65.3% in December 2025, which is a 0.5% decrease from the rate of 65.8% in November 2023. The Calgary Economic Region’s Labour Market Review shows that Calgary’s total employment base grew to 849,000 workers in February 2025, with the addition of 61,300 jobs. Statistics from the Labour Force Survey illustrate that the employment rate for women in February 2024 declined at a sharper rate than that of men, falling from 60.9% to 59.3%. HRReporter shows that unemployment in the youth sector may cost the Canadian economy $18.5 billion by 2034. |
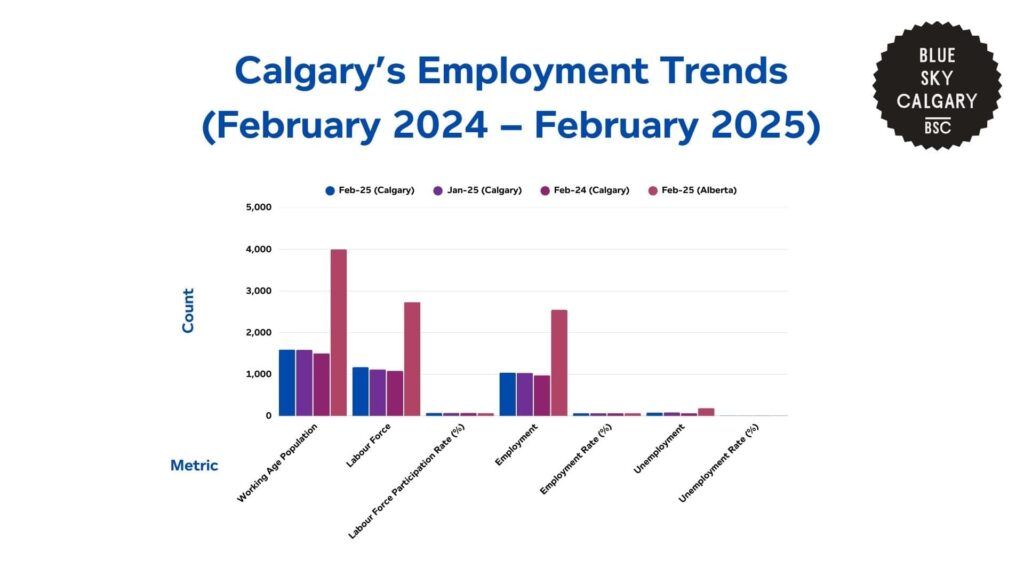
The Labour Market Review’s Report on Calgary for 2025 shows that Calgary’s working-age population increased by 88,500 individuals.
This population reached 1.592 million in February 2025, which is an increase of 5.9% from 1.503 million in February 2024.
Moreover, this growth resulted in an increase in the labor force, which is now at 1.171 million. They were up by 79,000 individuals and increased 7.3% year-over-year.
Overall employment in Calgary reached 1.038 million, increasing by 63,200 jobs or 6.5%, although the employment rate rose only slightly to 65.1% from 64.7%.
However, the number of unemployed individuals also rose to 80,300, which is an increase of 15,800 or 24.5%. This pushed the unemployment rate to 7.2%, up 1 percentage point from 6.2% in February 2024.
Compared to January 2025, Calgary’s unemployment rate improved from 7.4%, with 2,100 fewer unemployed individuals. Notably, it did remain higher than Alberta’s 6.8% unemployment rate in February 2025.
In Alberta, the working-age population grew by 174,200 people, reaching 4.001 million. This is a 4.5% increase from 3.827 million in February 2024.
The labor force also expanded to 2.734 million, increasing by 94,600 people or 3.6%, while the labor force participation rate declined slightly from 68.9% to 68.3%.
In comparison to January 2025, Alberta’s unemployment rate increased from 6.9%, as the number of unemployed individuals rose by 1,600. This indicates a slight slowdown in the labor market for the entire region.
| Metric | Feb-25 (Calgary) | Jan-25 (Calgary) | Feb-24 (Calgary) | Feb-25 (Alberta) |
| Working Age Population | 1,592 | 1,587 | 1,504 | 4,002 |
| Labour Force | 1,171 | 1,114 | 1,083 | 2,734 |
| Labour Force Participation Rate (%) | 70 | 70 | 69 | 68 |
| Employment | 1,038 | 1,031 | 973.6 | 2,547 |
| Employment Rate (%) | 65 | 65 | 65 | 64 |
| Unemployment | 80.3 | 82.4 | 64.5 | 187 |
| Unemployment Rate (%) | 7.2 | 7.4 | 6.2 | 6.8 |
Regional Analysis of Employment Trends Across Canada
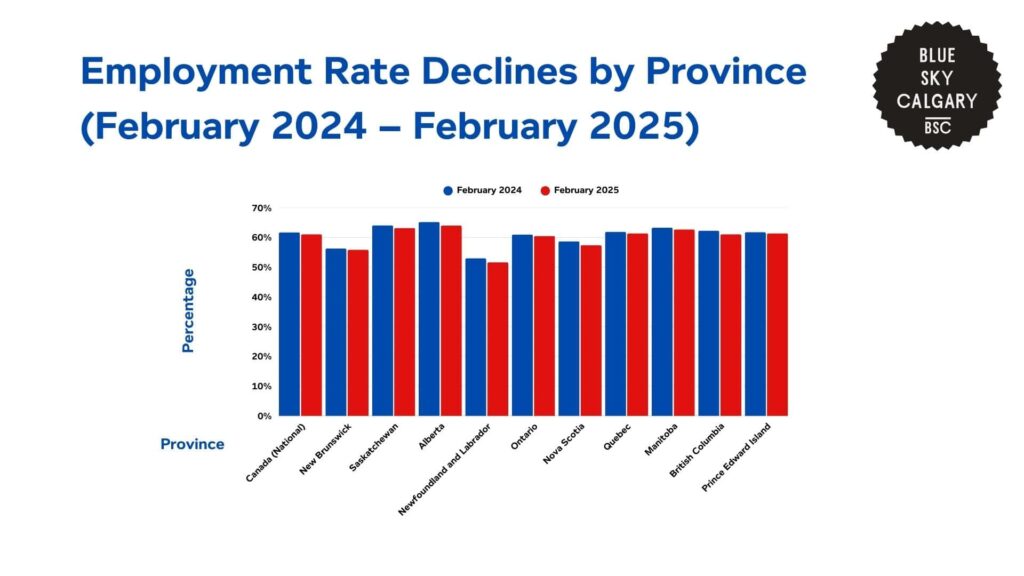
Data from the Alberta Economic Dashboard shows that the region’s employment rate declined to 64% in February 2025, which is a decrease of 1.2% from 65.2% in February 2024. This marks one of the largest declines among Canadian provinces.
Compared to British Columbia, which saw an identical 1.2 percentage point drop from 62.3% to 61.1%, Alberta maintains a higher employment rate but faces a similar downward trend.
Meanwhile, Saskatchewan’s employment rate fell to 63.2%, a 0.9 percentage point decrease from 64.1% in February 2024, which is slightly less severe than Alberta’s decline.
Manitoba also experienced a 0.6 percentage point drop, bringing its employment rate to 62.7%. This remains lower than Alberta’s but shows more stability.
Notably, Newfoundland and Labrador saw the most significant drop among all provinces, with its employment rate falling by 1.4 percentage points, from 53% to 51.6%, indicating persistent labor market challenges.
Ontario and Quebec experienced smaller declines, with Ontario’s employment rate dropping by 0.5 percentage points to 60.5%, while Quebec’s rate fell by 0.5 percentage points to 61.4%.
These provinces continue to have lower employment rates than Alberta, but their labor markets have been more stable.
| Province | February 2024 | February 2025 | % Change | Jan–Feb 2024 (AVG YTD) | Jan–Feb 2025 (AVG YTD) | % Change |
| Canada (National) | 61.70% | 61.10% | ↓ 0.6% | 61.80% | 61.10% | ↓ 0.6% |
| New Brunswick | 56.30% | 55.90% | ↓ 0.4% | 56.40% | 56% | ↓ 0.4% |
| Saskatchewan | 64.10% | 63.20% | ↓ 0.9% | 64.00% | 63% | ↓ 0.8% |
| Alberta | 65.20% | 64.00% | ↓ 1.2% | 65.20% | 64.10% | ↓ 1.0% |
| Newfoundland and Labrador | 53.00% | 51.60% | ↓ 1.4% | 53.20% | 51.70% | ↓ 1.6% |
| Ontario | 61.00% | 60.50% | ↓ 0.5% | 61.00% | 60.50% | ↓ 0.6% |
| Nova Scotia | 58.70% | 57.40% | ↓ 1.3% | 58.50% | 57.70% | ↓ 0.8% |
| Quebec | 61.90% | 61.40% | ↓ 0.5% | 61.80% | 61.40% | ↓ 0.4% |
| Manitoba | 63.30% | 62.70% | ↓ 0.6% | 63.80% | 62.80% | ↓ 1.0% |
| British Columbia | 62.30% | 61.10% | ↓ 1.2% | 62.40% | 61.20% | ↓ 1.2% |
| Prince Edward Island | 61.80% | 61.40% | ↓ 0.4% | 62.00% | 61.60% | ↓ 0.4% |
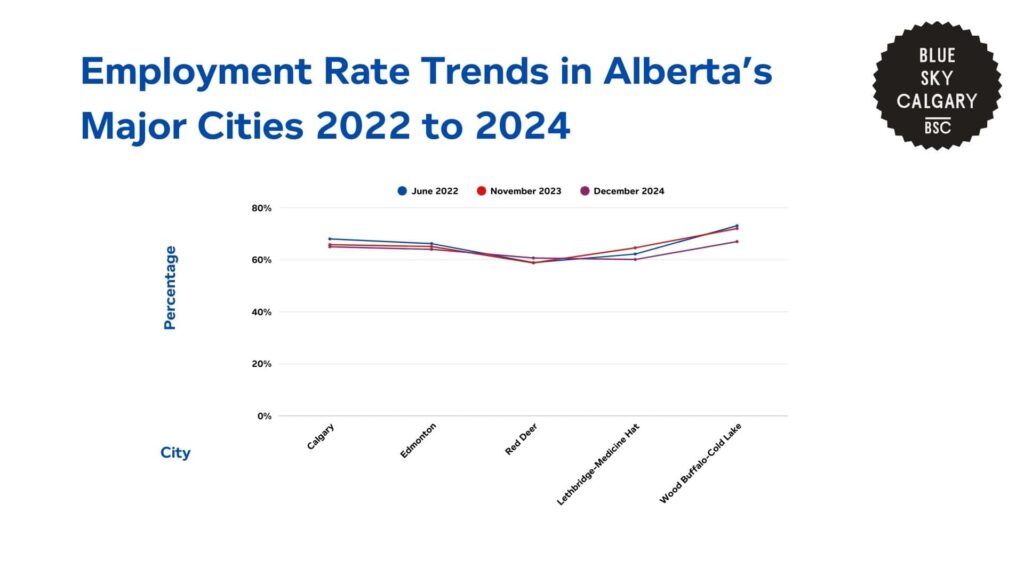
Statistics Canada also highlights unemployment rates within major cities in Alberta.
Calgary’s employment rate fell to 65.3% in December 2024, which is 0.5% lower than 65.8% in November 2023 and 2.7 percentage points lower than 68% in June 2022.
Although this drop indicates a decelerating labor market, Calgary is still one of Alberta’s more productive cities.
Edmonton’s job rate dipped to 63.7%, which is down 1.4 percentage points from November 2023. Their job rate has also dropped by 2.5% since June 2022, which is slightly lower than Calgary’s drop.
Meanwhile, Red Deer rose to 60.7% in December 2024. This is 1.9% above November 2023 and 1.8 percentage points above June 2022.
Although the city has improved, Red Deer still lags behind Calgary by 4.6 percentage points, reflecting a collectively weaker labor market.
Moreover, Lethbridge-Medicine Hat had the sharpest drop of 4.5 percentage points, from 64.6% in November 2023 to 60.1% in December 2024.
This drop also surpasses Calgary’s 0.5 percentage point decline during the same time period, which indicates that the labor market conditions worsened at a faster pace in this area.
Wood Buffalo-Cold Lake had the highest employment rate overall. However, it did experience a 5% decline from November 2023, as its rate dropped to 67% in December 2024.
| June 2022 | November 2023 | December 2024 | Change from November 2023 to December 2024 | Change from June 2022 to December 2024 | Difference from Calgary in December 2024 | |
| Calgary | 68.00% | 65.80% | 65% | ↓ 0.5% | ↓ 2.7% | — |
| Edmonton | 66.20% | 65.10% | 64% | ↓ 1.4% | ↓ 2.5% | ↓ 1.6% |
| Red Deer | 58.90% | 58.80% | 60.70% | ↑ 1.9% | ↑ 1.8% | ↓ 4.6% |
| Lethbridge-Medicine Hat | 62.20% | 64.60% | 60.10% | ↓ 4.5% | ↓ 2.1% | ↓ 5.2% |
| Wood Buffalo-Cold Lake | 73.10% | 72.00% | 67% | ↓ 5.0% | ↓ 6.1% | ↑ 1.7% |
City-Level Trends
The Calgary Economic Region’s Labour Market Review gives insights into employment trends in the city’s industries.
| Industry | Total Employees (‘000) | ||
| Feb-25 | Feb-24 | Change (y/y) | |
| Mining, Quarrying, and Oil and Gas Extraction | 43.9 | 45.1 | 1.2 |
| Utilities | 11.1 | 9.4 | 1.7 |
| Construction | 71 | 57.1 | 13.9 |
| Manufacturing | 45.9 | 45 | 0.9 |
| Wholesale Trade | 27.2 | 26.8 | 0.4 |
| Retail Trade | 103.2 | 84 | 19.2 |
| Transportation and Warehousing | 53.8 | 56.3 | 2.5 |
| Information and Cultural Industries | 15.9 | 12.2 | 3.7 |
| Finance and Insurance | 38.6 | 38.9 | 0.3 |
| Real Estate Rental and Leasing | 15.2 | 10.8 | 4.4 |
| Professional, Scientific, and Technical Services | 105.1 | 100.9 | 0.6 |
| Administrative and Support | 19.4 | 29 | 9.6 |
| Educational Services | 62.4 | 55.6 | 6.8 |
| Health Care and Social Assistance | 115.4 | 85 | 30.4 |
| Arts, Entertainment, and Recreation | 19.2 | 22.2 | 3 |
| Accommodation and Food Services | 46.2 | 50.5 | 4.3 |
| Other Services (except Public Admin) | 28.3 | 32.3 | 4 |
| Public Administration | 30.3 | 25.5 | 4.8 |
| All Industries | 849.1 | 787.8 | 61.3 |
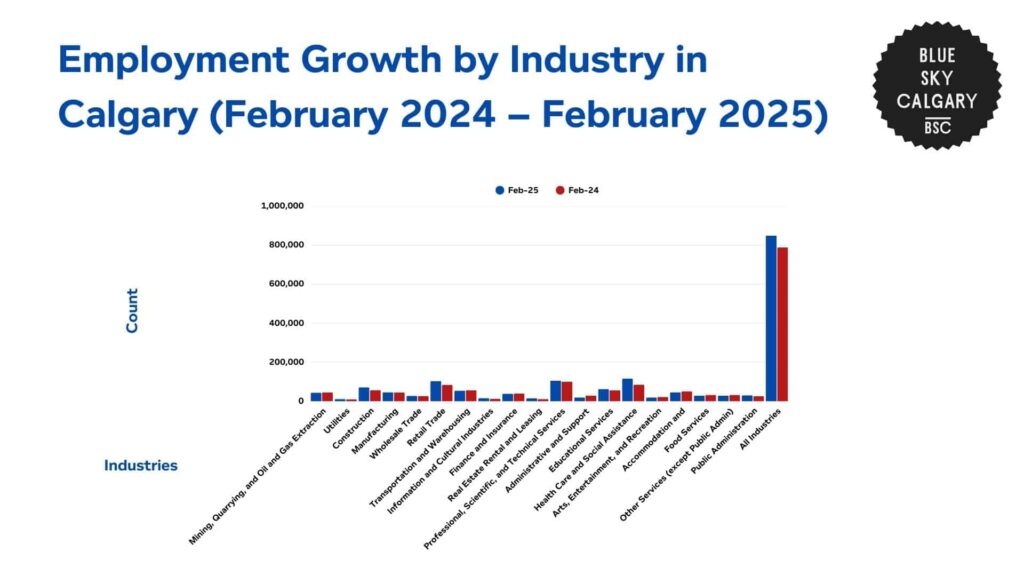
The data shows that Calgary’s overall employment base increased to 849,100 workers in February 2025, with the addition of 61,300 jobs. This is a 7.8% increase from the 787,800 workers in February 2024.
Among these industries, health care and social assistance experienced the biggest increase, with the addition of 30,400 jobs. This industry grew from 85,000 to 115,400 workers, which is a 30.4% increase.
Meanwhile, retail trade also saw significant growth, rising from 84,000 to 103,200 workers. This shows an increase of 19.2% and reflects increased consumer spending in the city.
Public administration, which employed 25,500 individuals, also saw an increase of 4.8%. This brought up their total number of workers to 30,300, and indicates stronger recruitment in a government office.
Moreover, the information and culture industries increased employment from 12,200 to 15,900, which is an increase of 3.7%. This includes growth in the media, digital, and communication sectors.
While overall employment increased, certain sectors did experience some declines.
Administrative and support services declined the most, falling from 29,000 to 19,400, which is a 9.6% decrease. This indicates substantial drops in business support positions.
Furthermore, employment in arts, entertainment, and recreation also fell from 22,200 jobs to 19,200. This is a decrease of 3% for the industry.
Demographic Breakdown of Employment Trends in Calgary
Calgary’s Labour Force Survey reveals discrepancies in unemployment rates across different demographics.
Employment Trends by Sex
| Sex | February 2024 | February 2025 | % Change | Jan–Feb 2024 (AVG YTD) | Jan–Feb 2025 (AVG YTD) | % Change |
| Female | 60.9% | 59.3% | -1.6% | 60.6% | 59.4% | -1.2% |
| Male | 69.6% | 68.6% | -1.0% | 69.8% | 68.7% | -1.0% |
| Both sexes | 65.2% | 64.0% | -1.2% | 65.2% | 64.1% | -1.0% |
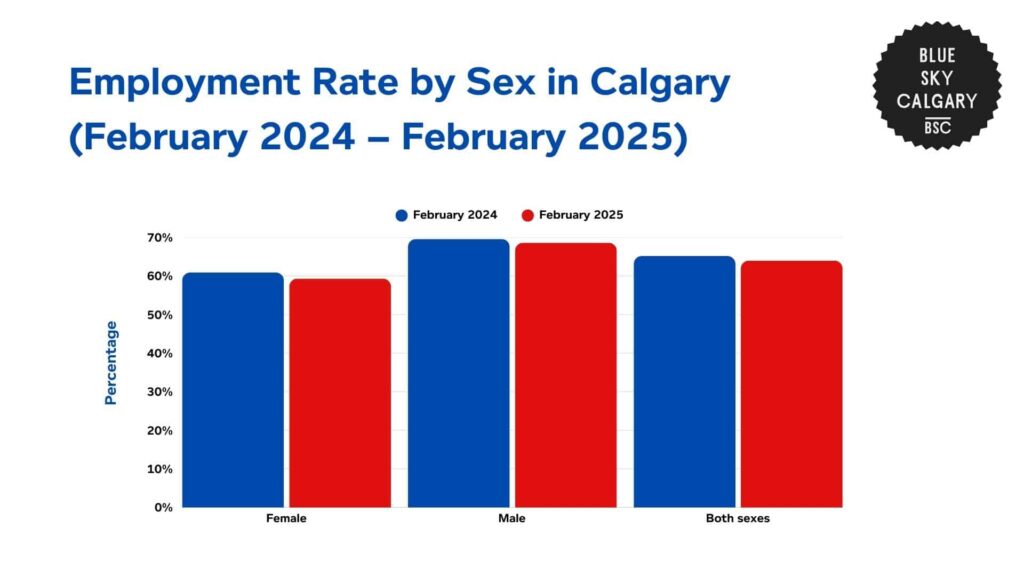
The employment level for both genders in Calgary fell to 64% in February 2025. This is 1.2% lower than the 65.2% rate in February 2024.
Meanwhile, the average employment rate over the year so far also fell from 65.2% in early 2024 to 64.1% in early 2025. This is a decrease of 1% and signals an overall weakening of labor market participation.
However, the employment rate for women fell at a sharper rate, dropping to 59.3% in February 2025 from 60.9% in February 2024. This represents a decline of 1.6%.
Moreover, the year-to-date average for female employment decreased from 60.6% to 59.4%, representing a 1.2% decrease. This indicates that women had a higher job loss compared to men.
Similarly, the employment rate for men dropped to 68.6% in February 2025, which is a 1% decrease from 69.6% in February 2024. The year-to-date average for men also dropped from 69.8% to 68.7%, which is again a 1% decrease.
In spite of this reduction, men still have a higher employment rate compared to women, with a 9.3% difference in February 2025, which increased slightly from 8.7% in February 2024.
Employment Trends by Age
| Age | February 2024 | February 2025 | % Change | Jan – Feb 2024 *AVG YTD) | Jan – Feb 2025 (AVG YTD) | % Change |
| 15 years and over | 65.20% | 64.00% | -1.20% | 65.20% | 64.10% | -1.00% |
| 25 to 54 years | 84.60% | 82.70% | -1.90% | 84.40% | 82.60% | -1.80% |
| 15 to 24 years | 55.30% | 55.20% | -0.10% | 54.80% | 55.80% | 0.90% |
| 55 years and over | 38.40% | 37.20% | -1.20% | 38.70% | 37.40% | -1.30% |
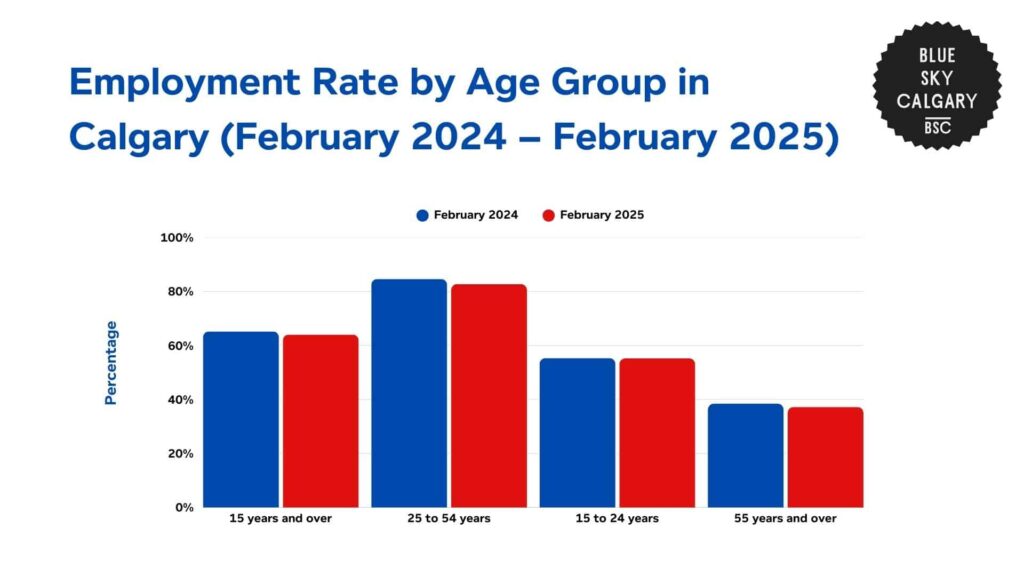
The report also reveals that the employment rate for the population 15 years and over fell to 64% in February 2025 from 65.2% in February 2024, which is a decrease of 1.2%.
Meanwhile, the year-to-date average dropped from 65.2% to 64.1%, which represents a decrease of 1%. This shows a minor slowing down of employment for this age group.
However, the most affected was the 25-to-54-year-old age bracket, which accounts for the majority of the workforce.
The unemployment rate for this group fell to 82.7% in February 2025, which is a decrease of 1.9% from the 84.6% rate recorded in February 2024. Similarly, the year-to-date average also dropped from 84.4% to 82.6%, which is a 1.8% decline.
With only a slight decline of 0.1%, the 15 to 24 age group maintained the most stable employment rate. This shows a drop from 55.3% employment to 55.2%.
Unlike other age groups, their year-to-date average also increased from 54.8% to 55.8%, which shows an increase of 0.9%. This indicates a modest improvement in youth employment opportunities.
The 55 and over age group saw a more significant decline, with the employment rate falling to 37.2% in February 2025 from 38.4% in February 2024. This shows a decrease of 1.2%.
Their year-to-date average also declined from 38.7% to 37.4%, which is a 1.3% decline. This suggests increasing challenges for older workers in securing or retaining employment.
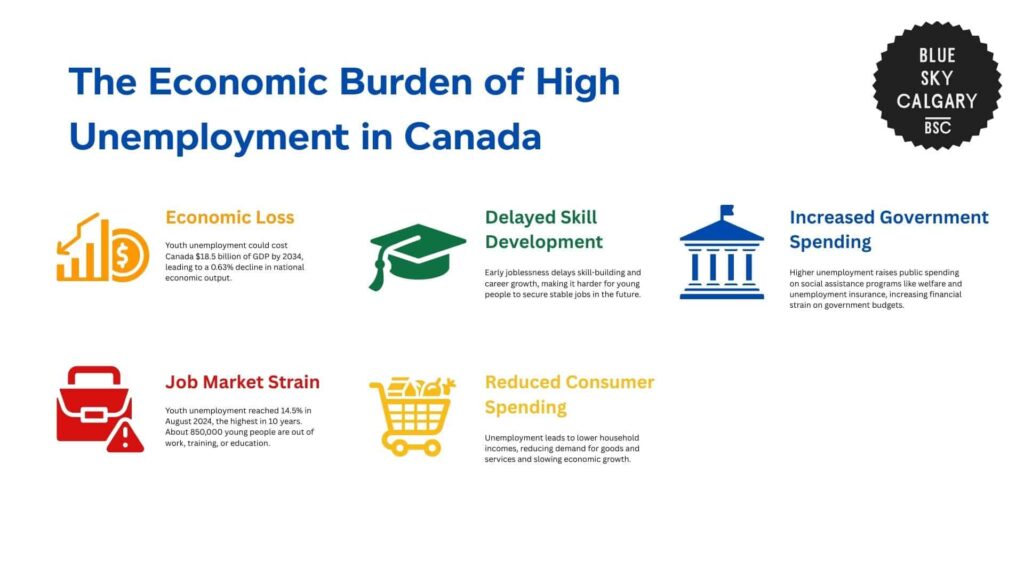
Costs and Consequences of High Unemployment
HRReporter discusses how youth unemployment creates serious economic burdens for cities in Canada.
Unless the issue is resolved, youth unemployment may cost the Canadian economy $18.5 billion of its GDP by 2034. This further translates into a 0.63% decline in the nation’s economic output.
As of August 2024, youth unemployment was at 14.5%, which is the highest it’s been in the past 10 years. This means that around 850,000 young people are neither in work, training, nor education.
This not only impacts the short-term earning capacity of these young people but also has long-term effects on their career progression.
The report discusses how early joblessness can have long-lasting negative impacts on the future income of a person, as this postpones the acquisition of productive skills, work experience, and knowledge.
Later on, this postponement can lead to a less skilled and less productive labor force, which has implications for total economic production.
A report by Reuters also discusses how high rates of unemployment can lead to reduced consumer spending, as unemployment leads to lower household incomes.
This reduction in demand can harm businesses, which could potentially lead to further job losses and a slowdown in economic growth.
Furthermore, higher unemployment rates cause increased government spending on social assistance programs like employment insurance and welfare benefits.
This further strains public finances and can cause higher deficits that impact the government’s ability to invest in other critical economic areas.
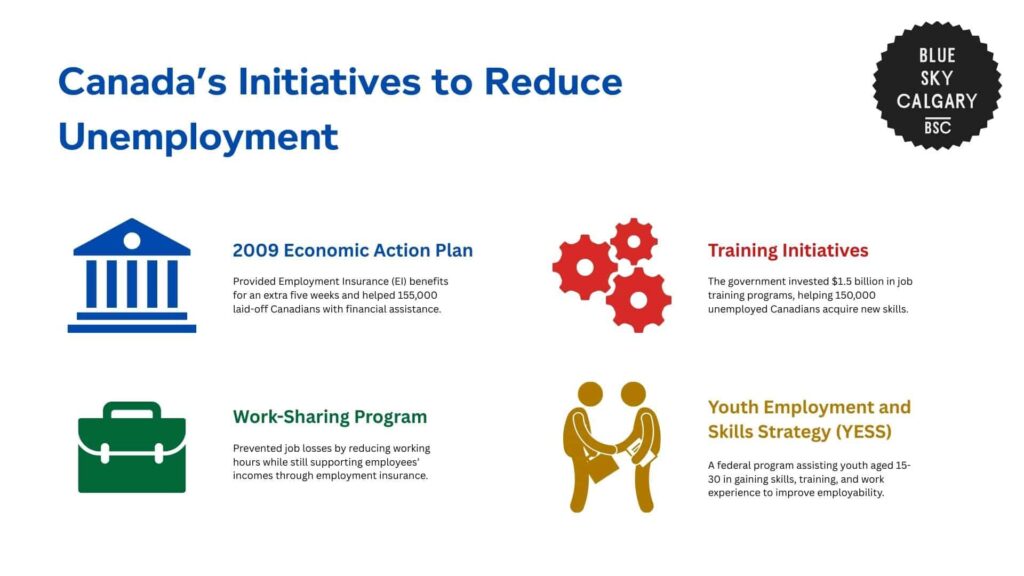
Interventions and Solutions to High Unemployment Rates
Canada has implemented several measures aimed at tackling high unemployment rates.
Notably, the 2009 Economic Action Plan was initiated in response to the international financial crisis. The plan lengthened Employment Insurance (EI) benefits by an extra five weeks, providing financial assistance to more than 155,000 laid-off Canadians.
It also increased the Work-Sharing Program, enabling companies to prevent job losses by cutting the working hours of employees but still supporting their income with employment insurance.
The government also spent $1.5 billion on training initiatives, which helped 150,000 unemployed Canadians acquire new skills and enhance their hiring potential.
Aside from straight financial support, youth job programs have also been given priority in addressing unemployment among younger age groups.
The Youth Employment and Skills Strategy (YESS) is a federal program aimed at assisting youth between 15 and 30 years of age in acquiring the skills and experience needed for employment.
YESS partners with organizations that offer job placements, employment support, and training programs to promote employability. This program adopts a flexible response to address the varying needs of youth throughout the nation
The Future of Calgary’s Employment Trends
As Calgary continues to grow, the demand for skilled workers in key sectors will define the future job market.
While jobs have increased in major sectors such as health care, construction, and retail trade, industries like administrative support and accommodation services have declined.
Government programs can contribute to stabilizing employment by promoting workforce training and increasing financial support.
Furthermore, Calgary could experience more volatile unemployment rates unless job creation remains aligned with labor force growth.
More investment in education, employee training, and employer incentives will be required to promote long-term job security and sustainable economic development.
With Calgary’s economy changing, worker skill development will play a critical role in ensuring labor market resilience and better opportunities for workers in various sectors.

References
- Calgary.ca. (n.d.). Labour market information. The City of Calgary. Retrieved from https://www.calgary.ca/research/labour-market.html
- Calgary.ca. (2025, February). Labour market review: February 2025. The City of Calgary. Retrieved from https://www.calgary.ca/content/dam/www/cfod/finance/documents/corporate-economics/labour-market-review/Labour-Market-Review-2025-02.pdf
- Government of Alberta. (n.d.). Employment rate dashboard. Economic Dashboard. Retrieved from https://economicdashboard.alberta.ca/dashboard/employment-rate/
- Statistics Canada. (n.d.-a). Table 14-10-0387-01: Labour force characteristics by province, seasonally adjusted. Retrieved from https://www150.statcan.gc.ca/t1/tbl1/en/tv.action?pid=1410038701
- Statistics Canada. (n.d.-b). Table 14-10-0287-01: Employment by industry, annual averages. Retrieved from https://www150.statcan.gc.ca/t1/tbl1/en/tv.action?pid=1410028701
- HR Reporter. (2024, March 7). Youth unemployment to cost Canadian economy $18.5 billion by 2034: Report. Retrieved from https://www.hrreporter.com/focus-areas/recruitment-and-staffing/youth-unemployment-to-cost-canadian-economy-185-billion-by-2034-report/389834
- Reuters. (2025, March 7). Canada’s economy adds few jobs in February; unemployment unchanged. Retrieved from https://www.reuters.com/markets/view-canadas-economy-adds-few-jobs-february-unemployment-unchanged-2025-03-07/
- Government of Canada. (2009, June). Canada’s Economic Action Plan: Helping the unemployed. Retrieved from https://www.canada.ca/en/news/archive/2009/06/canada-economic-action-plan-helping-unemployed.html
- Government of Canada. (n.d.). Employment Insurance (EI) program consultation: Building a better EI program. Retrieved from https://www.canada.ca/en/employment-social-development/programs/ei/consultation-better-program-backgrounder.html
- Government of Canada. (2009). Canada’s Economic Action Plan: Budget 2009 brief. Retrieved from https://www.budget.canada.ca/2009/pdf/brief-bref-eng.pdf
- Government of Canada. (n.d.). Youth Employment and Skills Strategy (YESS). Retrieved from https://www.canada.ca/en/employment-social-development/programs/youth-employment-strategy.html